data source · draft
USGS Mineral Commodity Summaries
The US Geological Survey's yearly report on more than 90 nonfuel minerals: US production, trade and import reliance, and world production and reserves, with free CSV tables.
What is reusable: unknown sourceopen dataAPI unknownunknown participation US public domain
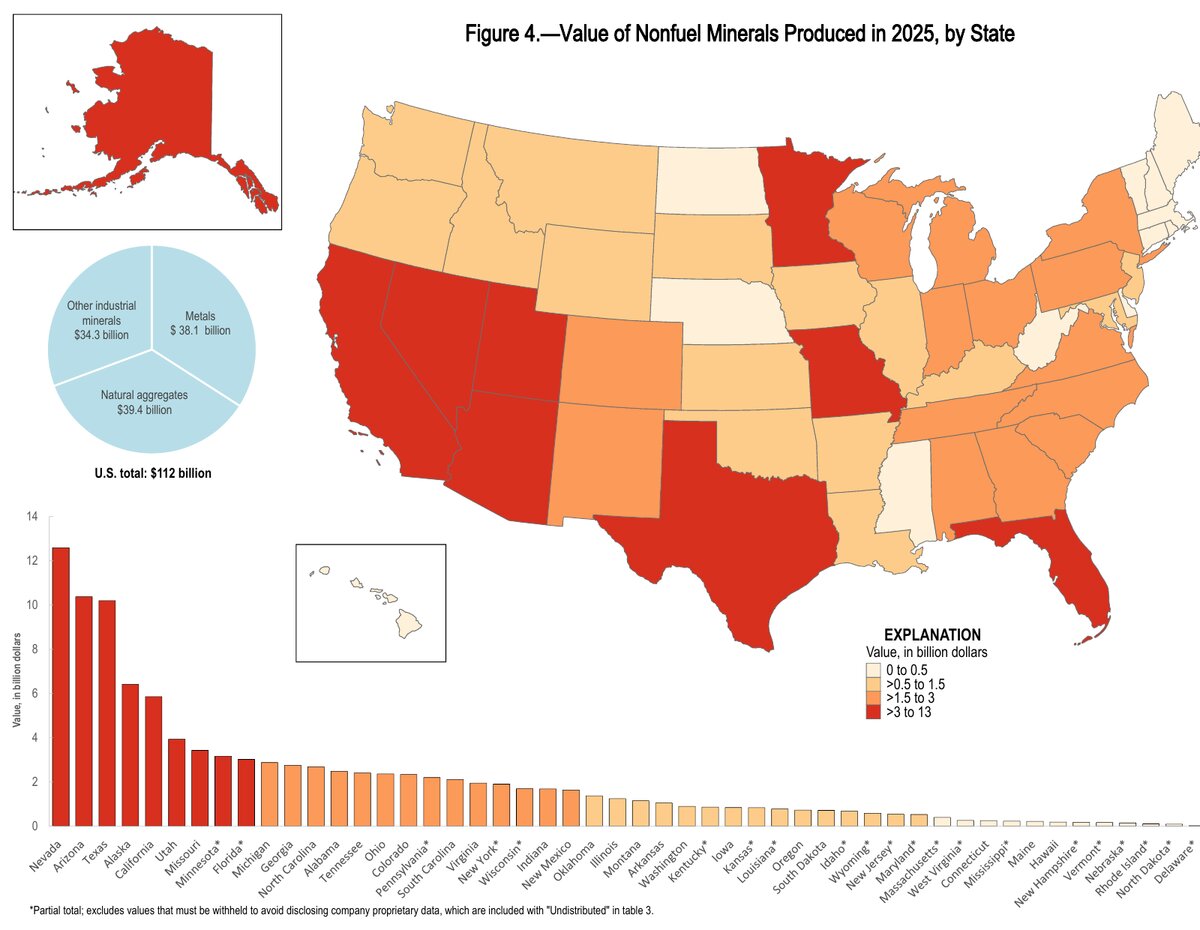
Value of nonfuel minerals produced in 2025, by state (Figure 4, Mineral Commodity Summaries 2026). USGS, public domain.
The Mineral Commodity Summaries are an annual report from the US Geological Survey's National Minerals Information Center.1 The USGS calls it the earliest government publication to give estimates for the nonfuel mineral industry each year.1 The 2026 edition, first released in February 2026 and revised to version 1.3 in May, runs to 222 pages and is the earliest comprehensive source of world mineral production data for 2025.2,3
More than 90 minerals and materials each get a two-page summary.1,2 Each summary covers recent events, trends and issues, the structure of the US industry, government programmes and tariffs, five years of US statistics, and world production, reserves and resources.2 The US statistics include production, imports, exports, price, stocks, apparent consumption and net import reliance, the share of US use met by imports.4 Opening chapters show the place of minerals in the US economy, the value produced in each state, net import reliance and import sources for critical minerals.2,3 Appendices define the terms and explain how reserves and resources are classified.2
Aluminium shows what a summary holds. In 2025 three companies ran six primary aluminium smelters in five US states, two of them temporarily shut down since 2022 and 2024, with a combined capacity of 1.31 million tons a year.3 Imports met 60% of US use, mainly from Canada, the United Arab Emirates, Bahrain and China.3 The chapter, covering 2025, records a 25% tariff on aluminium imposed in March, raised to 50% for most countries by June, and an estimated 660,000 metric tons of US primary production against about 74 million worldwide.3
The report is a free PDF, and editions back to 1996 are linked from the USGS page.1,3 The 2026 tables also come as a data release on ScienceBase, published on 6 February 2026: CSV files with metadata covering the US statistics and world production for each commodity, plus the tables and figures from the opening chapters.4 USGS-authored data and information are in the US public domain, and the USGS asks to be credited.5
For someone modelling a place, the summaries give a quick, sourced answer to how much of a mineral a country produces, holds in reserve and trades, and the share of US use met by imports.2,4 They are national figures, with US production values also given by state.3 The scenario US aluminium supply under the 50% tariff is about the smelters, imports and tariffs these figures describe.
- coverage
- United States in detail; world production, reserves and resources by country
- resolution
- national, by mineral commodity; US values by state
- cadence
- annual; the 2026 edition (February 2026) covers 2025, with five years of US statistics; editions online from 1996
- access
- free PDF report and a ScienceBase data release of CSV tables with metadata
- format
- PDF; CSV
- homepage
- https://www.usgs.gov/centers/national-minerals-information-center/mineral-commodity-summaries
needed by
-
The United States imports most of its aluminium and taxes it at 50%, while building a new smelter takes years. What does that do to the price American manufacturers pay, and can domestic smelting come back?
Tags: minerals, mining, critical minerals, import reliance, reserves, public domain