Communication
Ways of putting a model in front of the people it concerns, from local graphics to pieces they can play with.
A model can be right and still change nothing, because the people who live with its answer never meet it, or meet it as a chart they cannot question. This shelf is the step after presentation: not drawing a result, but getting it to the people it concerns in a form they can use.
There are two halves to it. One is showing: local graphics a weather presenter can put on air, a single number made to mean something in one town, an animation that makes a slow change visible. The tools for this have changed quickly, and making motion graphics no longer takes a studio.
The other half is playing, and there is much less of it. Here the reader is handed the levers: they set the emissions path and watch the temperature move, draw their own guess before seeing the data, or take a role in a meeting where the model is the table everyone is arguing over. Bret Victor called these explorable explanations. Journalists have built them, so have games, and so have researchers who run a model with the people whose land it describes. Most are still one-off pieces. A tool that lets anyone play with a real scenario of their own place, with real data underneath, is mostly still to be built.
The scenarios are where both halves get tested: each one names who needs an answer, and an answer that never reaches them has not been given.
Playing

Participatory research approach from a group of mainly CIRAD scientists that builds role-playing games and agent-based models together with the people who use the land or resource.
People & societyCities & placesLiving systemsFood & land open participation

Facilitated sessions and a role-playing summit from Climate Interactive in which a group proposes climate policies and sees their effect on warming in the En-ROADS simulator as they go.
Weather & climateEnergyPeople & society closed sourcepartly open participation
-
Essay by Bret Victor, 2011, proposing documents whose reader can change the author's assumptions and see the consequences, with working examples built on his Tangle library.
-
Financial Times game from 2022 in which the reader, as global minister for future generations, makes three rounds of choices to 2050 and sees the warming their path leads to.
-
New York Times Upshot interactive, 2015, by Gregor Aisch, Amanda Cox and Kevin Quealy, in which readers draw their guess of a relationship before the chart reveals the data.
-
Playable post by Vi Hart and Nicky Case, 2014, built on Thomas Schelling's segregation model, in which readers move shapes, set their bias and watch a mixed neighbourhood sort itself apart.
People & societyCities & places open sourceno APIopen participation
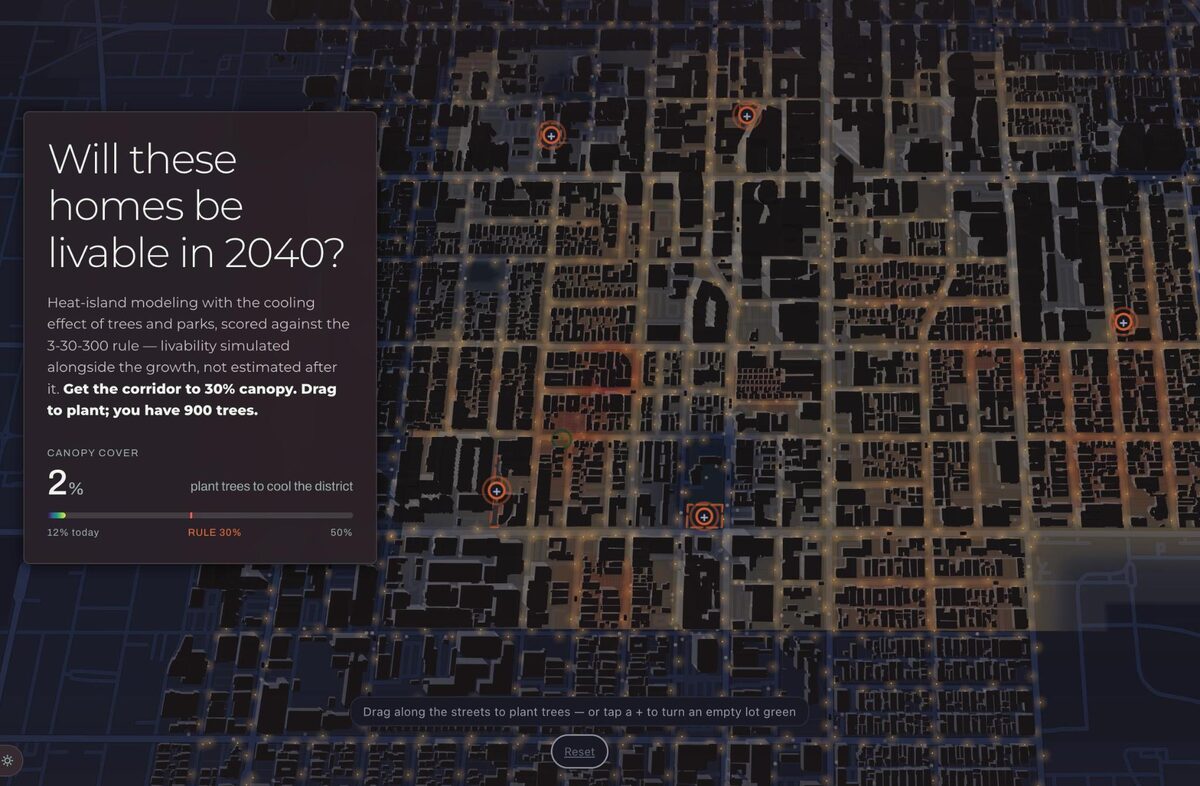
Urbanly's home page: five screens, each a planning question with a target, where the reader drags schools, stops, jobs and trees to meet it.
Cities & placesPeople & society closed sourceopen participation
-
Role-playing game of UN climate negotiations from Climate Interactive, MIT Sloan and UMass Lowell, in which delegates' pledges are tested live in the C-ROADS climate model.
Weather & climatePeople & society open participation
Showing
-
Climate Central's pages for about 250 U.S. cities and every state, each showing how that place's temperature, rainfall and extreme heat have changed since 1970, with downloadable local graphics.
Weather & climateCities & places partly open data
-
Climate Central's free weekly service of localized climate graphics, data and explainers for TV meteorologists and journalists, localized for more than 245 U.S. cities and media markets.
Weather & climatePeople & society partly open datapartly open participation
-
Climate Central's daily world map scoring, from -5 to +5, how much more or less likely human-caused climate change has made each place's temperature on a given day.
Weather & climatePeople & society partly open dataAPI unknown
-
Open-source Python engine for precise, programmatic animations, begun by Grant Sanderson for his 3Blue1Brown math videos and forked in 2020 into a community edition.
open sourceAPIopen participation
-
Framework for making videos and motion graphics in code with React, fed by data and rendered in bulk or played live in a web page, under a source-available licence.
partly open sourceAPIpartly open participation