question · proposed
Ecosystems and land management
If land changes use, farm to housing, forest to pasture, floodplain to park, what happens to water, habitat, carbon and food?
A piece of land is about to change. Someone wants to know what it does to the stream below it, the species on it, the carbon in it, or the food it grows, and whether a different plan would do better.
What you are really asking
Land is where the systems meet. Change the cover and you change how rain runs off, what lives there, what is stored in the soil and trees, and what the land yields. So the question splits by what you care about, and most people care about two or three at once:
- Water: runoff, erosion, what reaches the stream.
- Habitat: which species lose or gain, and whether the pieces still connect.
- Carbon: what is stored and what is released.
- Food: what the land can grow and how that changes with weather.
What kind of model answers it
Models of ecosystem services take a land-cover map and estimate each of these for the current map and for an alternative. They are built to compare scenarios, not to forecast a number to the decimal, and their value is in showing which plan is better and where. Crop models go deeper on the food question, simulating growth under given weather, soil and management. Integrated assessment models connect land to energy, water and the economy at the scale of a region or the world, which is the right tool when the question is a policy rather than a parcel.
On this site: InVEST for ecosystem services, DSSAT for crops, GCAM for the regional and global scale, and Earth Index for finding features in satellite imagery.
What you need
- A land-cover map now and under each plan. Satellite data from Copernicus is free; the plan is yours to draw.
- Terrain and soils.
- Species records: iNaturalist holds observations people have made in your area.
- What the land yields now, from the people who farm it.
If a mandate sent you
The 30 by 30 target turns this question into a counting one first: which land counts as conserved, where the gaps by habitat are, and what a change of use would do to coverage and connectivity. Protected Planet is the record it is measured against.
Without a model
Overlay the plan on the land-cover map and list what each parcel changes from and to. Walk it with an ecologist and a farmer. Most of the trade-offs are visible from that table.
Next
Find the data. Who Drinks the River? shows a land-and-water question told as a playable story.
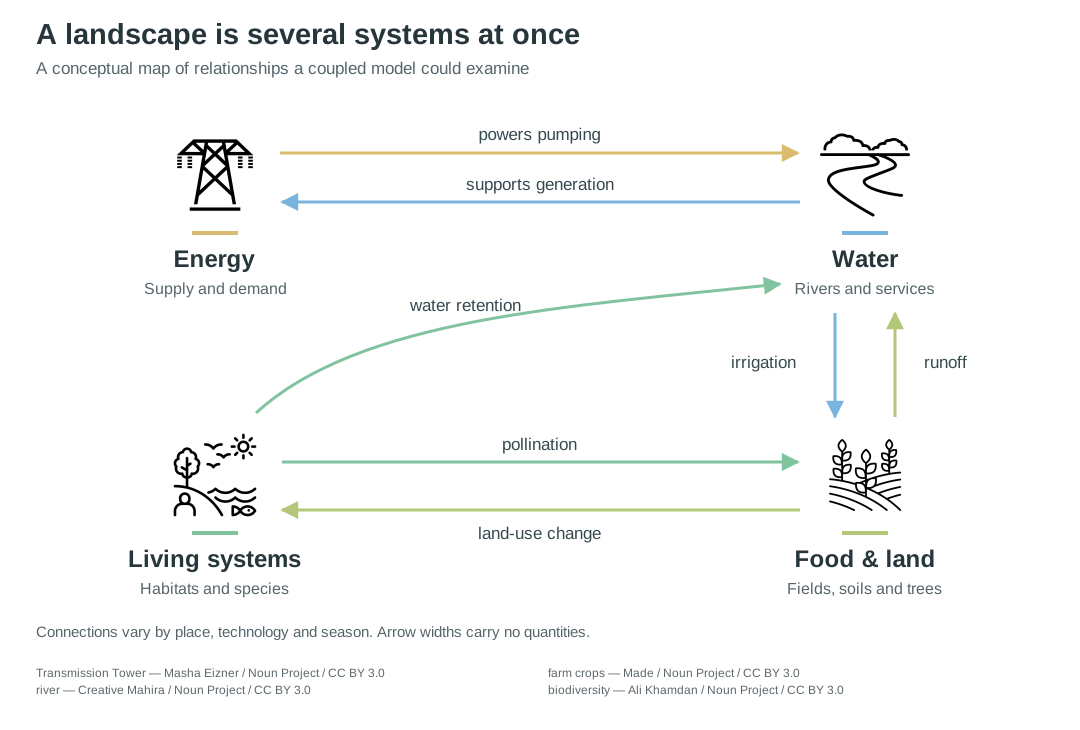
A conceptual map of relationships a coupled model could examine. Connections vary by place, technology and season; arrow widths carry no quantities. Icons via Noun Project, CC BY 3.0.
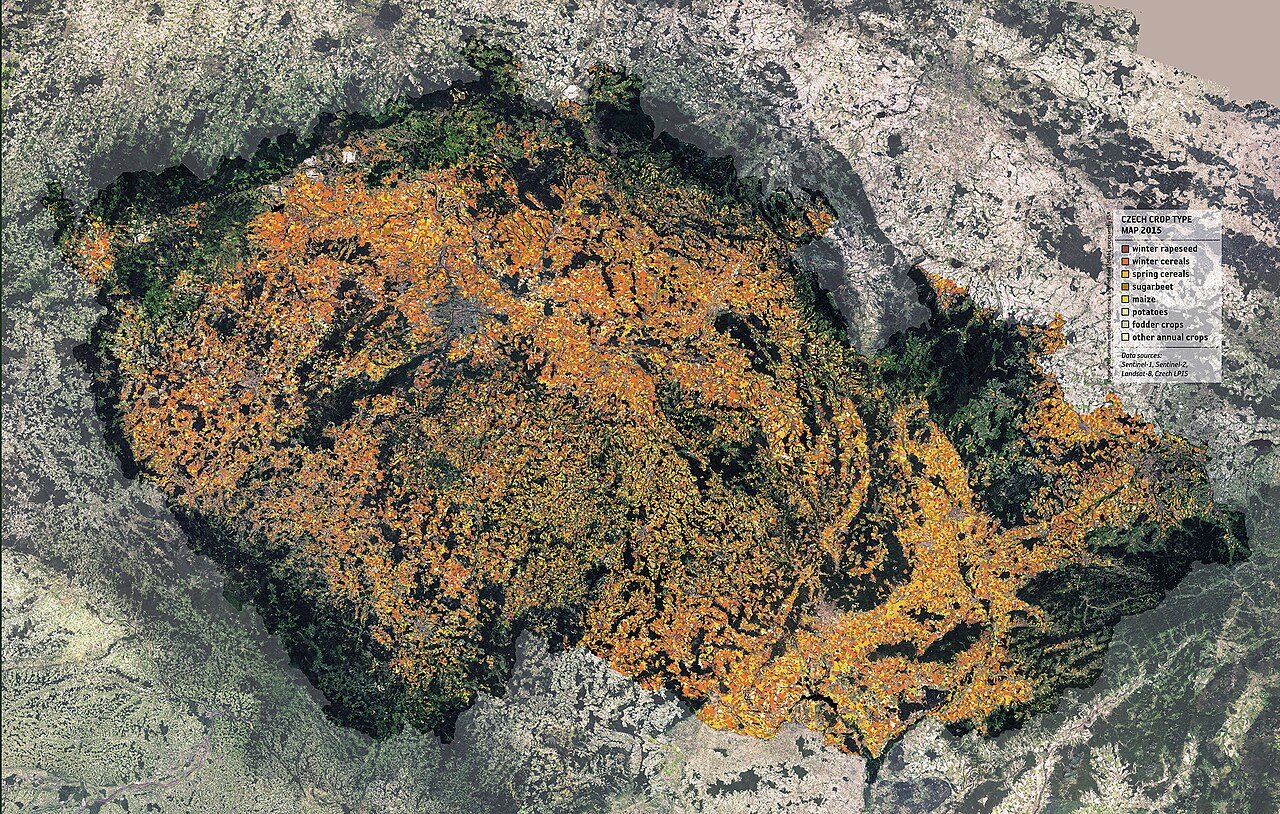
Crop types across Czechia from 2015 Sentinel and Landsat observations: classification that turns imagery into data a land-use model can use. Credit: ESA / DUE Sentinel-2 for Agriculture project; contains modified Copernicus Sentinel data (2015), CC BY-SA 3.0 IGO, source.

discussed in
-
Recent reports, from a creek in Kentucky to the Strait of Hormuz, each read for the question someone there would put to a model of their place, and the kind of model that would answer it.
answered with
-
Open-source program that borrows algorithms from electronic circuit theory to predict how animals, plants and genes move across a landscape, treating every possible path at once; written in Julia.
open sourceopen participation
-
DSSAT (Decision Support System for Agrotechnology Transfer) simulates crop growth, development and yield from daily weather, soil and management data, with models for over 45 crops; free to download.
-
Earth Genome's hosted search tool for satellite imagery; a user labels a few known sites and it finds similar places anywhere on Earth, for detecting mines, cattle facilities, airstrips and other land change.
closed source
-
Global Change Analysis Model from the Joint Global Change Research Institute; links energy, water, agriculture and land, the economy and climate in long-run global scenarios.
open sourceopen participation
Open-source suite of ecosystem-service models from the Natural Capital Alliance at Stanford; maps and values what nature provides in terrestrial, freshwater, marine, coastal and urban settings.
open sourceopen dataopen participation
raised by
-
Target 3 of the Kunming-Montreal Global Biodiversity Framework, adopted under the Convention on Biological Diversity: by 2030 at least 30 per cent of land, inland waters and coastal and marine areas effectively conserved through protected areas and other area-based measures.