question · draft
Weather and climate
What weather is coming this week, and how will the climate of this place change over decades?
Two questions people ask in the same breath, answered by different models at different scales. The one you need depends on whether you are planning a weekend or a seawall.
What you are really asking
- The forecast: what will happen in the next hours to two weeks. Global weather models answer it, and you almost never need to run one yourself.
- The projection: how temperature, rain, sea level and extremes shift over the coming decades under a given emissions path. Climate models answer it, at a coarse grid, and the work in a local study is in bringing the result down to your place.
- The local picture: how hot a particular street gets on a summer afternoon, which depends on buildings, trees and surfaces as much as on the regional climate. That is urban microclimate modelling, and it is where a neighbourhood question lives.
What kind of model answers it
Weather and climate models solve the physics of the atmosphere on a grid. The newest ones learn from decades of past weather instead and run far faster; the entries on this site for AIFS from ECMWF and Aurora from Microsoft Research describe two that are open. Destination Earth is the European programme building climate and extremes twins at continental scale, and WeatherNext and NVIDIA Earth-2 are two commercial routes to the same kind of forecast.
For the street-level question, friGIS is a hosted tool that puts a microclimate model behind a planning editor for trees, surfaces and water. Open tools exist for the same job and are not yet on this site.
What you need
- For projections: the published climate scenarios for your region, which your national weather service or a university will have downscaled already.
- For the local picture: buildings, tree canopy and surface types for your area, and summer temperature observations to check against. The New York tree map is an example of what a city-wide tree dataset looks like.
- A record of what has already happened: Climate Reanalyzer shows the global and regional series, and Vitals on this site tracks six of them.
Without a model
Read your region's published climate projection and the last three summers' temperature record. For a heat question, go out at four in the afternoon with a thermometer and walk from a treed street to a bare one. The difference you measure is the thing the model is for.
Next
answered with
-
Nature paper by Emanuele Bevacqua, Erich Fischer, Jana Sillmann and Jakob Zscheischler that ranks CMIP6 climate models by a sector-specific impact driver and shows that at 2 °C of warming the worst-case models for floods, breadbasket droughts and forest fire weather exceed the model average at 3 °C.
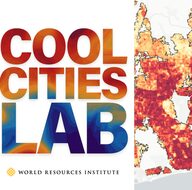
World Resources Institute's web tool that maps heat hazard, exposure and cooling opportunity in a city and estimates how much street trees, cool roofs or shade structures would lower air temperature and thermal stress, at neighbourhood and city scale.
open sourceopen dataAPI

The European Commission's Destination Earth builds digital twins of the Earth system, implemented by ECMWF with ESA and EUMETSAT, for climate change adaptation and weather-induced extremes.
-
Two AI weather-forecasting stacks: Google DeepMind's WeatherNext 3, a hosted global model that forecasts hourly and feeds Google products and cloud datasets, and NVIDIA's Earth-2, a family of open models and tools that organisations run on their own GPUs.
partly open sourceopen dataAPI
discussed in
-
Global storm-resolving atmosphere simulation output from the DOE E3SM project's SCREAM model, repackaged by NVIDIA as Zarr on Hugging Face for training and testing machine-learning weather and climate emulators.
open data