data source · draft
eBird
Cornell Lab of Ornithology project in which birders submit complete checklists; the records, and weekly abundance maps modelled from them, are free for research and education.
Living systemsPeople & society
What is reusable: unknown sourcepartly open dataAPIopen participation
eBird is a bird-observation project managed by the Cornell Lab of Ornithology with hundreds of partner organisations.1 Birders note the time, place and effort of each outing and list every bird they saw or heard.1 The project receives more than 100 million sightings a year.1 While entering a checklist, observers are shown the birds likely for that date and region, and regional experts review unusual birds and high counts.1
The raw records come in several forms.2 The eBird Basic Dataset holds every observation with its effort details and coordinates. It is updated on the 15th of each month, and any logged-in user can download it after filling in a short project description.2 A companion file of checklists alone helps establish where a species was looked for and not found.2 Sensitive species are obscured in the public outputs.2 A yearly extract with species, date and place goes to the Global Biodiversity Information Facility, and an API serves limited recent and summary data to anyone with a personal key.2
eBird Status and Trends models the checklists to map each species. Its models combine eBird data with satellite imagery from NASA, NOAA and USGS to estimate where, when and in what numbers each species occurs in every week of the year.3 The April 2025 release covered 2,974 species, estimated for 2023, on a grid of 3 km cells.4 Relative abundance there means the count an expert birder would make on a one-hour, 2 km traveling checklist at the best time of day.4 The models use only complete checklists from 2009 through 2023 that record start time, duration, distance and number of observers.4 Trend maps show the cumulative change in relative abundance on 27 km cells over 7 to 15 years, for 842 species.4 The data products are released six months after the maps, through an access request form, as GeoTIFF downloads or through the ebirdst package for R.3,4
The data are free but not unrestricted. The terms allow use for research and education, require citation, and forbid commercial use without written permission. They also forbid republishing the original data, and data derived from them must carry the same terms.5 Status and Trends products cannot be used commercially at all for now.4
- coverage
- global
- resolution
- individual checklists with place, time and effort; modelled weekly relative abundance on a 3 km grid
- access
- free with a Cornell Lab account and a short request form; API with a personal key; non-commercial terms
- homepage
- https://ebird.org/
needed by
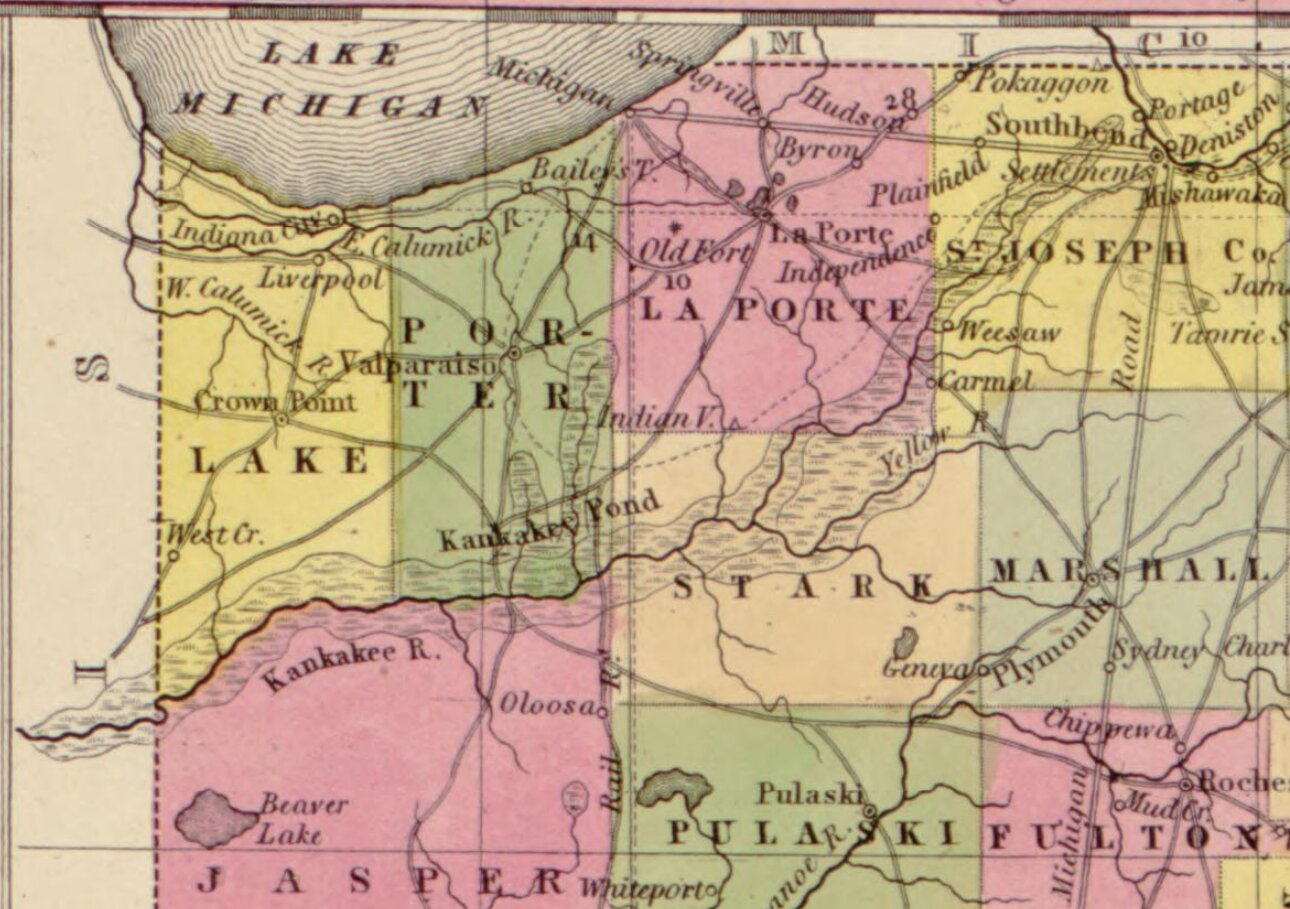
A vast Indiana marsh full of ducks, geese, cranes and herons was drained for farms by 1918, and its nesting birds thinned out or left. What would putting water back do for birds and floods?
Tags: birds, observations, community science, migration, abundance maps