article · draft
Global warming has accelerated significantly
Grant Foster and Stefan Rahmstorf take the estimated effect of El Niño, volcanoes and the sun out of five global temperature records; what is left shows warming speeding up since about 2015.
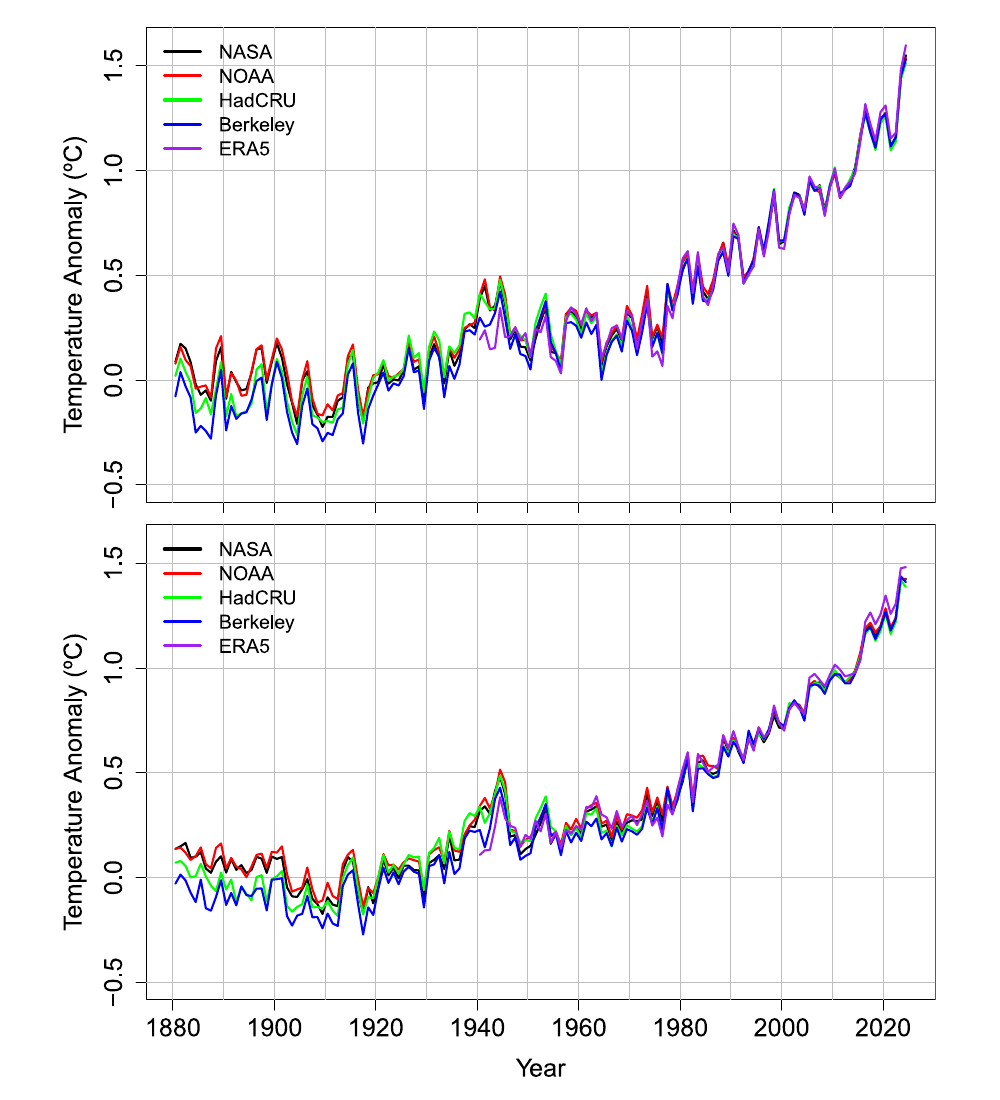
Global temperature since the 1970s has been rising at about 0.2 °C a decade, with plenty of wobble around that line.2 The record years 2023 and 2024 started an argument about whether the line had bent upward. An earlier test on the raw records, by Beaulieu and colleagues in 2024, found no significant change; the authors repeated it with 2024 added and still did not reach 95% confidence.2
Their move is to take out the wobble they can explain. Three things push global temperature around from year to year and are each measured independently: El Niño and La Niña, read from the Niño 3.4 index; haze from volcanic eruptions; and the sun's cycle, read from sunspot counts. They fit how much each one moves temperature, and with what delay in months, then subtract that from the record.2 The fit is done on 1950 to 2024 and then applied back to 1880. The picture above is their Figure 1: five records raw on top, adjusted below, where the peaks after strong El Niño years such as 2016 are much smaller.2
On the adjusted records two different tests find acceleration. A curve fitted from 1970 confirms it at better than 98% confidence in all five records. A search for the year the slope changed puts the break in 2013 or 2014, at over 99% confidence.2 The five records are NASA GISTEMP, NOAA GlobalTemp, HadCRUT5, Berkeley Earth and ERA5.2
| Record | Warming rate now (°C per decade) | Slope changed | Crosses 1.5 °C |
|---|---|---|---|
| NASA | 0.36 | April 2013 | 2028 |
| NOAA | 0.36 | February 2013 | 2028 |
| HadCRU | 0.34 | January 2014 | 2029 |
| Berkeley | 0.36 | February 2014 | 2028 |
| ERA5 | 0.42 | February 2014 | 2026 |
These rates come from the change-point model. A smooth curve gives lower present rates, 0.25 to 0.29, but a moving ten-year window sides with the change-point figures.2 "Crosses 1.5 °C" means the fitted trend line reaching the Paris limit, not a single hot year.2
The main weakness is stated in the paper: the subtraction is empirical and approximate, and some of El Niño's effect on 2023 and 2024 may remain.2 They do not try to explain the cause; the leading candidate in other work is less cooling haze from cleaner air.2
The method is the part worth borrowing. Any local record, a river's temperature, a reef's heat stress, a city's summer nights, mixes a slow trend with swings whose drivers are measured elsewhere. Fitting and subtracting those drivers before asking whether the trend has changed is what let a signal show here that the raw data could not confirm. Their R code and input data are on Zenodo under CC BY 4.0.3 The Vitals page carries running global temperature and Niño 3.4 series. The paper is open under CC BY 4.0, so its figure can be shown here.1
- url
- https://doi.org/10.1029/2025GL118804
- published
- 2026-03-06
- publisher
- Geophysical Research Letters (AGU)
- authors
- G. Foster, S. Rahmstorf
helps answer this question
-
What weather is coming this week, and how will the climate of this place change over the coming decades?
Tags: climate, global temperature, acceleration, natural variability, statistics, paper