data source · draft
Copernicus DEM
The European Union's global elevation model from the TanDEM-X radar mission, a surface model of the land including buildings and trees, free worldwide at 30 m (GLO-30) and 90 m (GLO-90).
What is reusable: unknown sourceopen dataAPIunknown participation free licence for GLO-30 and GLO-90, with a required source notice
The Copernicus DEM is a digital elevation model (DEM), a grid of heights covering the Earth's land, published by the European Union's Copernicus programme and ESA through the Copernicus Data Space Ecosystem.1 It is a digital surface model: it gives the height of the top surface, including buildings, infrastructure and vegetation, rather than of the bare ground beneath them, which a digital terrain model would give.1 The data were acquired by the TanDEM-X radar satellite mission between 2011 and 2015 and come from an edited version of the WorldDEM model, in which water bodies were flattened, rivers made to flow consistently, and coastlines, airports and implausible terrain corrected.1 Gaps were filled from other elevation models, including SRTM, ASTER, GMTED2010, ALOS World 3D and national models for Norway and Spain.1
There are three versions. GLO-30 and GLO-90 cover the world's land, about 149 million km², with a grid spacing of 1 and 3 arc-seconds, roughly 30 and 90 metres.1 EEA-10 covers 39 European countries at 10 metres.1 The stated accuracy is better than 4 m in height and 6 m in position (90% of points), with relative height error under 2 m on slopes of 20% or less.1 Heights are in metres above the EGM2008 geoid, a model of mean sea level.1 Each tile comes with quality layers: masks for editing, filling and water bodies, and a height error map.1 The data were first released in December 2019; later releases to July 2024 corrected errors, filled gaps over Norway and Spain, and in December 2023 opened the GLO-30 tiles for Armenia, Azerbaijan and Moldova.1 The datasets are to be maintained until 2026.1
GLO-30 and GLO-90 are free worldwide for anyone who registers, while EEA-10 can be downloaded only by public authorities, EU institutions, Copernicus services and operators, and EU-funded research projects.1 Anyone using GLO-30 or GLO-90 in public must give a source notice crediting DLR, Airbus Defence and Space, the European Union and ESA.1 The data come as GeoTIFF or DTED files in 1-degree tiles, through the Copernicus Browser, APIs, and bulk download over S3-compatible storage.1 Copies of GLO-30 and GLO-90 from the 2021 release are also on Amazon Web Services, in public buckets that need no AWS account.2 They are Cloud Optimized GeoTIFFs, files laid out so that software can read just the part it needs.2 Ocean areas have no tiles there.2
For someone modelling a place, the Copernicus DEM gives the height of the land almost anywhere on Earth, from which slope and aspect can be computed; the AWS listing links a tutorial that does this in Python.2 Because it is a surface model, roofs and tree canopy are part of the heights.1 The Copernicus page warns that this matters when comparing it with bare-earth terrain models, such as those made from lidar.1
- coverage
- global land, about 149 million km²; a 10 m version (EEA-10) covers 39 European countries for eligible users only
- resolution
- 1 arc-second (about 30 m) for GLO-30, 3 arc-seconds (about 90 m) for GLO-90
- cadence
- radar data acquired 2011 to 2015; released 2019 with corrective releases to 2024; no regular updates
- access
- Copernicus Browser, APIs and bulk S3 download from the Copernicus Data Space Ecosystem with a free account; public S3 copies on AWS with no account
- format
- GeoTIFF and DTED in 1° tiles; Cloud Optimized GeoTIFF on AWS
- homepage
- https://dataspace.copernicus.eu/explore-data/data-collections/copernicus-contributing-missions/collections-description/COP-DEM
helps answer this question
-
Which areas will flood, how often, and what would changing a river, drain or pump do to the flooding?
does a similar job
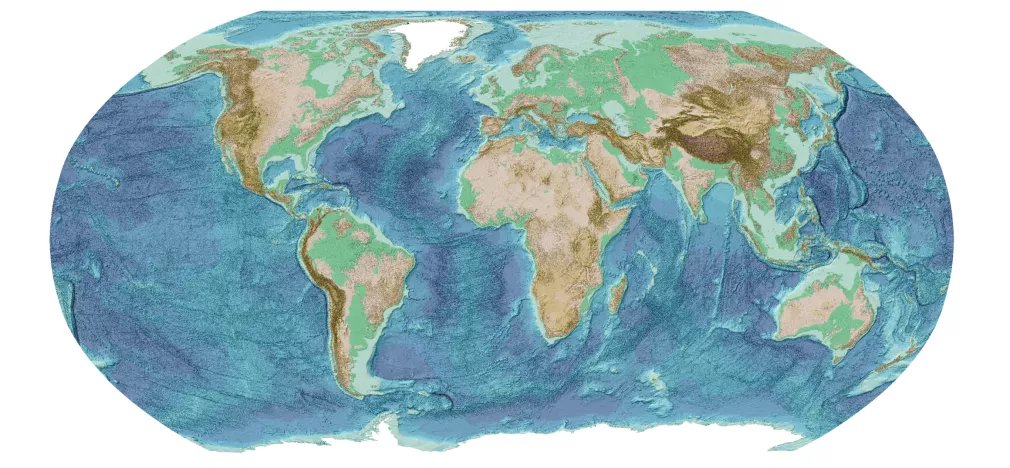
Free global map of the depth of the seafloor, with land heights, on a 15 arc-second grid, released once a year by the General Bathymetric Chart of the Oceans and the Seabed 2030 project.
open dataopen participation
alternative to
-
Free global map of the depth of the seafloor, with land heights, on a 15 arc-second grid, released once a year by the General Bathymetric Chart of the Oceans and the Seabed 2030 project.
open dataopen participation
Tags: elevation, terrain, DEM, topography, radar, raster