data source · draft
National Land Cover Database (NLCD)
USGS land cover maps of the United States at 30 metres from Landsat imagery; Annual NLCD gives land cover, change and paved surface for every year since 1985.
What is reusable: unknown sourceopen dataAPI unknownunknown participation CC0 1.0 (public domain, no use constraints)
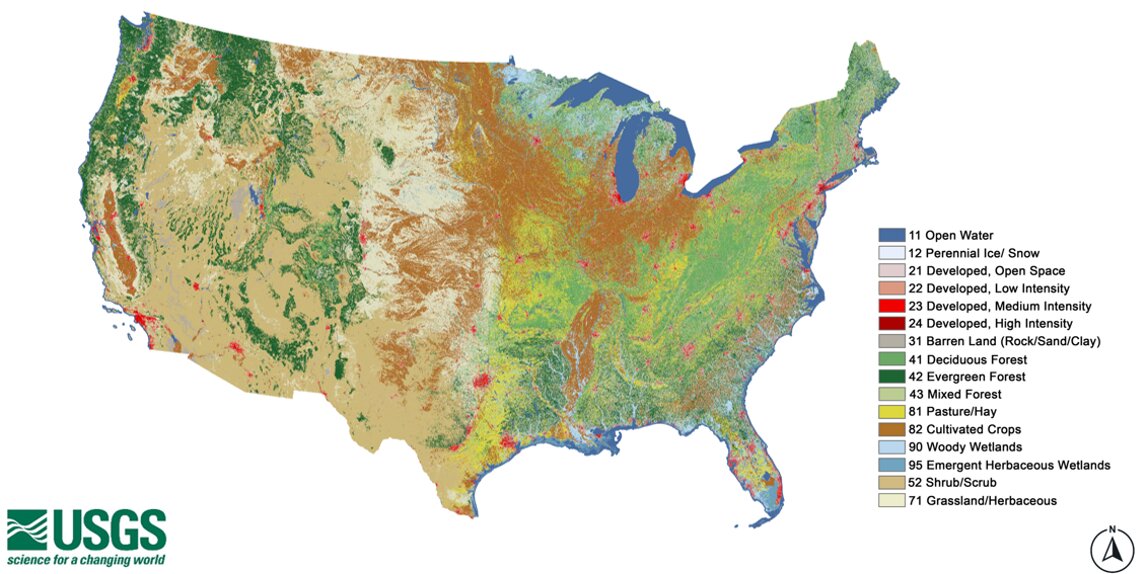
The National Land Cover Database is made by the USGS Earth Resources Observation and Science (EROS) Center with the Multi-Resolution Land Characteristics (MRLC) consortium, a group of federal agencies that coordinate national land cover mapping.1,3 The MRLC home page lists ten partner agencies and programs, LANDFIRE one of them.1 Land cover is what covers the ground: forest, crops, pasture, wetland, water, or pavement and buildings. NLCD maps it from Landsat satellite imagery.1,2
The legacy NLCD maps the conterminous United States in nine epochs from 2001 to 2021 (2001, 2004, 2006, 2008, 2011, 2013, 2016, 2019 and 2021), at 30 metres, with a 16-class legend based on a modified Anderson Level II classification.3 Alongside land cover it gives a change index and urban impervious surface as a percentage of each pixel.3 A descriptor layer picks out roads, wind turbine sites, buildings and energy production sites.3 The consortium has also mapped Alaska, Hawaii and Puerto Rico.1
Annual NLCD is the newer series. It builds on the methods of legacy NLCD and the USGS LCMAP land change project, adds deep learning, and maps every year.1,2 Each year has six products.1 Land cover, change from the year before, and the confidence of each land cover call make up three.1 Two describe paved and built surface: the fraction of each pixel it covers, and whether it is road or other developed land.1 The sixth gives the day of the year on which a marked change in the Landsat signal was seen.1 Collection 1.2, released in June 2026, covers 1985 to 2025 for the conterminous United States at 30 metres; products for Alaska and Hawaii are planned, and the series is to be updated annually.2,5 The first release, in October 2024, covered 1985 to 2023, and version 1.1 added 2024 in June 2025.5 Validation reports give the accuracy and uncertainty of the land cover products.2
The Forest Service builds a Tree Canopy Cover dataset as part of NLCD, annual from 1985 to 2025 at 30 metres, from Landsat and Sentinel-2 imagery and Forest Inventory and Analysis data.1
Annual NLCD can be downloaded from USGS EarthExplorer and ScienceBase, and as full mosaics from the MRLC direct download site.4 In the MRLC viewer you draw or upload an area, pick products and years, and download instructions arrive by email.4 It is also served as WMS map layers and from a requester-pays USGS bucket on Amazon S3, where whoever downloads pays the transfer cost.4 The MRLC Enhanced Visualization and Analysis (EVA) tool gives county statistics of change between any two dates.1,4 The data carry a CC0 1.0 public domain dedication with no use constraints.5
A model of a county or watershed can use NLCD to say how much of it is forest, farmland, wetland or developed, and with the annual series how that has changed since 1985 and where. Among the uses USGS lists are projecting future land use, modelling wildfire hazard and tracking water quality and quantity.2 The impervious surface layers say how much of each pixel is paved or built over.1,3
- coverage
- conterminous United States for Annual NLCD (Alaska and Hawaii planned); legacy NLCD also mapped Alaska, Hawaii and Puerto Rico
- resolution
- 30 m
- cadence
- Annual NLCD each year from 1985, updated annually (Collection 1.2, June 2026, runs to 2025); legacy NLCD in nine epochs from 2001 to 2021
- access
- downloads from EarthExplorer, the MRLC viewer and direct download site, ScienceBase, WMS services and a requester-pays AWS S3 bucket
- format
- raster mosaics and tiles; WMS
- homepage
- https://www.mrlc.gov/
helps answer this question
-
If land changes use, farm to housing, forest to pasture, floodplain to park, what happens to water, habitat, carbon and food?
Tags: land cover, land use, impervious surface, Landsat, change over time, raster