everyday · draft
How clean is the air on this street?
How much fine particle and traffic pollution reaches one street, judged against health guidelines, from monitors, home sensors and street-level maps.
Sensory landscapeMovement & logisticsFire
Someone with a child who has asthma wants to know whether the air outside their door is worse than the air two streets over. The answer turns on what is burning or running nearby: a highway, a bus depot, a port, a restaurant's grill, a wood stove, a wildfire a hundred miles upwind. It turns on the season and the hour, and on how far the door is from the kerb. The number most people see, the city's daily index, comes from a few monitors that may be miles away.
Who asks, and who they ask today
People choosing a home or a school ask, and so do parents, people with heart or lung conditions, runners and cyclists, outdoor workers, and neighbours of a road, port or plant. Many check the daily Air Quality Index in a weather app. Some own a home sensor, or look at a neighbour's on a public map. Developers and public agencies hire consultants who model emissions and dispersion for permits.
What answers it
The Air Quality Index and its monitors. In the United States the Air Quality Index (AQI) is EPA's tool for telling people about outdoor air and health.1 It covers ground-level ozone, particulate matter (PM2.5 and PM10), carbon monoxide, sulfur dioxide and nitrogen dioxide, with six bands from Good (0 to 50, green) to Hazardous (301 and higher, maroon).1,2 EPA's technical document (May 2026) sets out the method: take the highest concentration of each pollutant among the monitors in a reporting area, convert it to an index by straight-line interpolation between fixed breakpoints, and report the highest of those indices.2 For a 24-hour PM2.5 average, 0.0 to 9.0 µg/m³ is Good and 9.1 to 35.4 is Moderate.2 Metropolitan areas of more than 350,000 people must report it daily.2 For the current hour, AirNow uses the NowCast, which relates the latest hourly readings to the index for ozone and particles.2 AirNow's data come from state, local and tribal agencies using EPA-approved methods and are preliminary; the validated record is EPA's Air Quality System, which EPA's AirData site serves through downloads, an interactive map of monitors and an API.3,4 The index is a regional answer: it reports the worst monitor in an area, not the air at one door.2
What level is too much. The WHO global air quality guidelines (2021) set the guideline level for PM2.5 at 5 µg/m³ as an annual mean and 15 µg/m³ over 24 hours, with interim targets from 35 down to 10 µg/m³ annually for places far above it.6 For nitrogen dioxide, a traffic pollutant, the annual guideline is 10 µg/m³.6 WHO's fact sheet (October 2024) says 99% of the world's population lived in 2019 where its guideline levels were not met.7 EPA's own annual PM2.5 standard, set on 7 February 2024, is 9.0 µg/m³, and EPA revised the AQI at the same time.5
Low-cost sensors. PurpleAir sells particle sensors for homes, schools and businesses and runs a public map; it says more than 35,000 sensors in more than 100 countries report to it.8 Raw PurpleAir readings run high. Barkjohn, Gantt and Clements at EPA compared almost 12,000 paired 24-hour measurements in 16 states and found that the sensors overestimate PM2.5 by about 40% in most of the United States.11 Their correction, which uses relative humidity, cut the root mean square error of the raw data from 8 to 3 µg/m³.11 That correction and their data-cleaning rules were applied to PurpleAir data across the country on the AirNow Fire and Smoke Map.11
Street-level variation. Apte and colleagues fitted Google Street View cars with fast-response instruments and drove every street in a 30 km² area of Oakland, California, repeatedly. Their maps of annual daytime nitric oxide, nitrogen dioxide and black carbon at a 30-metre scale showed stable patterns, with levels varying up to five to eight times within a single city block because of local sources.12 Fixed monitors miss variation at that scale, and it is the scale of a front door.
Models for one street. A dispersion model such as GRAL computes how pollution from roads and other sources spreads between buildings, from traffic, weather and street geometry, which can come from OpenStreetMap.14 UrbanAIR is a research project bringing Destination Earth forecasts down to street level for air quality in European cities.15
Who sells an answer
PurpleAir sells sensors and data. Its API serves real-time and historical PM1.0, PM2.5 and PM10 readings, particle counts, temperature, humidity and pressure, metered in prepaid points; it says new accounts start with one million points and owners of active sensors get free points.9,10 Its data licence requires attribution and forbids resale or deposit in a public repository.10 It sells bulk datasets for studies on quote.10
Google's Air Quality API, part of Google Maps Platform, says it gives hourly air quality at 500 by 500 metre resolution in more than 100 countries.13 It offers more than 70 air quality indexes, health recommendations and colour-coded map tiles, with up to 30 days of history and forecasts up to 96 hours.13 Its 500-metre grid is finer than a city's monitors and coarser than the block-by-block variation Apte and colleagues measured.13,12
What a small look ahead adds
A lookup says how the air was. A model can say how it will be on this street. Smoke from a distant fire can give a clean street its worst air of the year. A model that knows the fire season, the fuel and the wind can say how many smoke days a household should plan for, and when a filter or a closed window matters; the wildfire question covers the fire side. Traffic change works the same way at a smaller scale. A new bus lane, a truck route, a moved school drop-off or a fleet that goes electric would each change the street's nitrogen dioxide and black carbon. A street-scale model can show which side of the road and which floor gains or loses. Forecast models such as Aurora already include air pollution, and a corrected sensor on the street gives a model a way to check itself.
Layers it shares
Road traffic, building geometry, wind and weather, fire and population also serve the noise, heat and commute questions.
- asked by
- people choosing a home or a school, parents of children with asthma, people who run, cycle or work outdoors, neighbours of a busy road, port or plant
- answered by
- the daily Air Quality Index, home sensor owners and their neighbours, weather and map apps, environmental consultants
requires this data or input
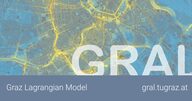
The Graz Lagrangian Model from Graz University of Technology; simulates the dispersion of pollutants and odour in built-up areas and complex terrain, including low-wind conditions and road tunnel portals.

Volunteer-built open map database of the world, covering roads, buildings, land use and places, and the base layer for most models of places.
open dataopen participation
Tags: air quality, PM2.5, Air Quality Index, low-cost sensors, traffic pollution, wildfire smoke