everyday · draft
How much shade and cooling do the trees on this street give?
How much tree canopy covers one street or block, how much it cools the air on a summer day, and what planting or losing trees would change for its residents.
Weather & climateLiving systemsPeople & societyCities & places
On a hot afternoon one street can be cooler than the next, and trees are a large part of the difference. Someone asking about their own street wants to know how much of it is shaded, how much that cools the air where they walk and sleep, and what would change if trees were planted or cut down. The answer turns on how much canopy there is, how it is spread across the block, how much pavement and roof sits around it, and who lives underneath.
Who asks, and who they ask today
Residents ask when a street feels hot or a tree is about to be removed. City foresters ask it of every block when they decide where to plant. People buying a house ask it while choosing between streets. Today residents ask the city's forestry department or an arborist, city foresters use tree inventories and canopy maps, and buyers look at the street themselves.
What answers it
How much canopy. The USDA Forest Service publishes Tree Canopy Cover maps at 30 metres for the conterminous United States, coastal Alaska, Hawaii, Puerto Rico and the US Virgin Islands, for every year from 1985 to 2025, from Landsat and Sentinel-2.6 They are made in two versions: a Science product with a standard error on every pixel, and an NLCD version cleaned for mapping.6 Thirty metres is coarser than a single street tree, so finer maps help. Meta and the World Resources Institute's High Resolution Canopy Height Maps give tree heights from half-metre imagery.12,13 Google's Environmental Insights Explorer estimates canopy across city regions from aerial imagery with machine learning.7 Some cities have tree-by-tree maps, such as the NYC Tree Genus Map.14
What the trees do. The USDA Forest Service's i-Tree tools are free.1 Since 2006 they have been run as a partnership with the Davey Tree Expert Company, the Arbor Day Foundation, American Forests and others.1 Until December 2025 they were funded mainly by the Forest Service and Davey in equal shares.1,4 MyTree and i-Tree Design assess single trees, and Design adds building interactions and forecasts.2 i-Tree Eco, a Windows program, takes field data from single trees, full inventories or sample plots, with local hourly weather and air pollution.2,3 From these it estimates pollution removal, carbon, avoided runoff, effects on building energy, and UV.3 i-Tree Canopy estimates land cover by random points on aerial imagery, and i-Tree Landscape joins canopy with census maps to find planting priorities.2 In December 2025 i-Tree said a new Forest Service IT policy had halted the cooperative agreement with Davey that paid for i-Tree.4 In May 2026 it reported one-time funding from CAL FIRE and the Forest Service's International Programs and Trade team for outreach and user support, while hosting and maintenance funding was still lapsed.4 It has promised at least six months' warning before any core tool goes offline.4
How much cooler. Ziter and colleagues (PNAS, 2019) carried air temperature sensors on bicycles along ten transects in a midsized Upper Midwest city.8 Daytime air temperature across the city varied by 3.5°C on average.8 It fell nonlinearly as canopy rose, with the greatest cooling once canopy passed 40 percent, and the effect was strongest at the size of a typical city block, 60 to 90 metres.8 At night trees did little, and pavement mattered more.8 The Cool Cities Lab from the World Resources Institute estimates how much street trees, cool roofs or shade structures would lower air temperature and heat stress in a neighbourhood.11
Who lives underneath. American Forests' Tree Equity Score covers every urban census block group in the United States.5 Each block group gets a canopy goal from its biome (40 percent for forest, 20 for grassland and Mediterranean, 15 for desert), adjusted for building density.5 Existing canopy comes mostly from Google's high-resolution canopy data, or local maps in cities with their own analyzers.5 The gap between goal and canopy is weighted by a priority index of seven equal parts.5 Five come from the census: income, employment, race, age and language.5 One is a health burden index from CDC PLACES.5 The last is how much hotter the block group's summer surface is than its urban area, from 2022 Landsat 8 scenes.5 The score runs from 0 to 100, and 100 means the block group meets its goal.5 Its benefit estimates use i-Tree multipliers and assume 600 square feet of canopy per urban tree.5
Who sells an answer
PlanIT Geo sells TreePlotter, tree inventory and canopy software it says is used by governments, private businesses and nonprofits, and offers inventory and consulting services.9 With NatureQuant it sells NatureScore, which it describes as a 0 to 100 score of the health effects of the green and blue space around a location, built by machine learning from 30 data sources, available for any US location.10 Its listed starting prices for NatureScore data alone run from $2,000 a year for a place of under 50,000 people to $7,000 a year for one over 250,000, and more when bundled with TreePlotter.10
What a small look ahead adds
A canopy map shows the trees that stand today. A model of the street can grow them: young trees widen over decades, old ones decline, and a planned removal or a new row of plantings changes the shade years before it shows on a map. It can set that shade against projected summer heat and show which hours and which side of the street gain most. It can weigh trees against pavement too, since the Ziter study found pavement drove night heat.8 i-Tree Design already forecasts the benefits of a single tree.2 Run block by block, the same idea lets a resident or a forester compare plans.
Layers it shares
Canopy and tree heights, building footprints and heights, surface heat and climate projections, which the garden, heat, solar and flood questions also need.
- asked by
- residents, city foresters, home buyers, neighbourhood tree groups
- answered by
- city forestry departments, arborists and tree inventory firms, free tree benefit calculators, neighbourhood scores sold to cities
requires this data or input
-
Tree height maps from Meta and the World Resources Institute, estimated from half-metre satellite imagery with an open model; global and regional maps are free to download as GeoTIFF.
open sourceopen data
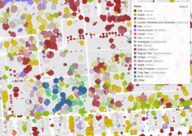
Cornell map and dataset of about 1.8 million New York City tree crowns classified to genus from PlanetScope satellite imagery and airborne lidar, including trees on private land and in natural areas.
open sourceopen data
World Resources Institute's web tool that maps heat hazard, exposure and cooling opportunity in a city and estimates how much street trees, cool roofs or shade structures would lower air temperature and thermal stress, at neighbourhood and city scale.
open sourceopen dataAPI
Tags: street trees, tree canopy, shade, urban heat, cooling