digital twin · draft
Crane radar
A live map of common crane migration over the Netherlands and its neighbours that joins birdwatchers' sightings to wind forecasts and flight models to show where flocks will likely pass.
What is reusable: unknown sourceunknown dataAPI unknownopen participation The map is open to the general public. Anyone can add to it by reporting crane sightings on waarneming.nl or observation.org. The paper says the source code and interview data are published on 4TU.ResearchData.
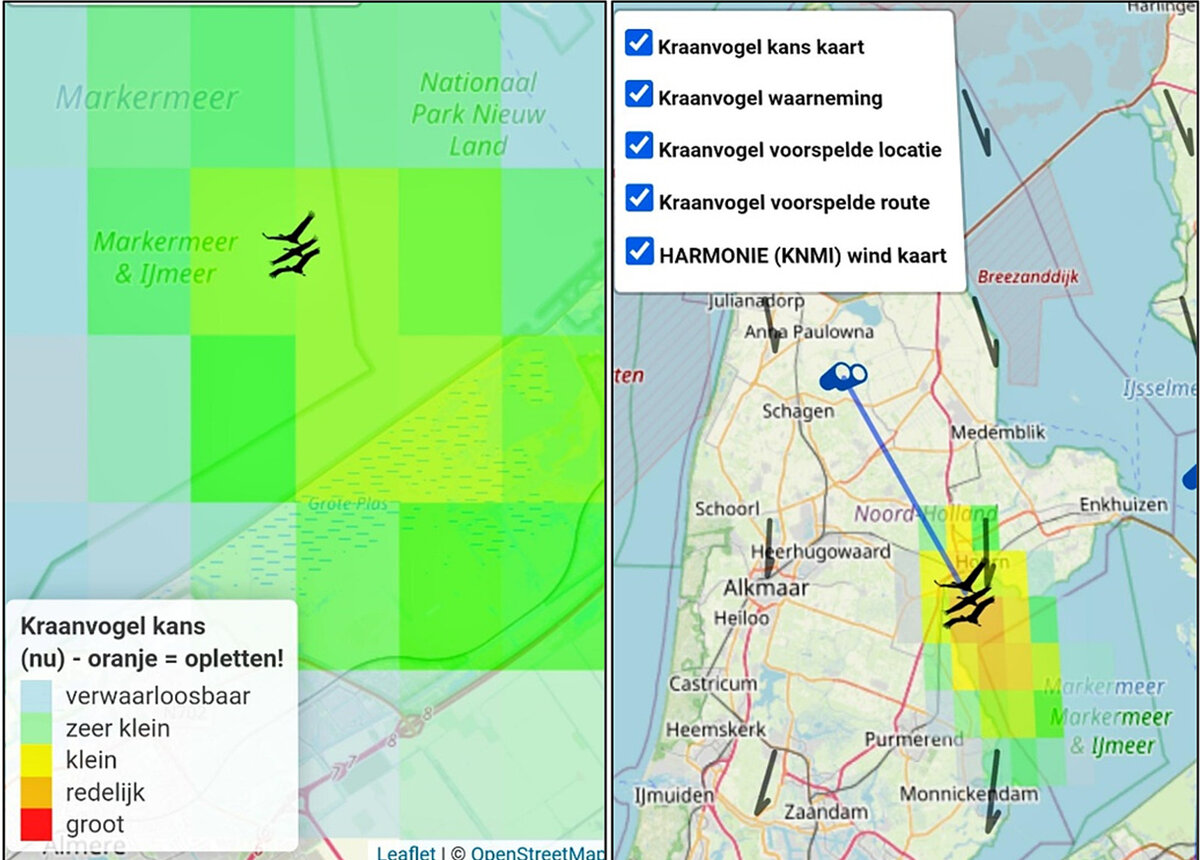
The crane radar during autumn migration: the chance of seeing cranes per grid cell, a sighting, and the predicted flock it was linked to. Figure 2 of de Koning 2025, CC BY 4.0; map OpenStreetMap.
The crane radar is a live model of the migration of the common crane (Grus grus) over the Netherlands, Belgium, Luxembourg and parts of northern France and northwest Germany.2 It shows the cranes birdwatchers have reported, predicts where each flock is now, and colours a map by the chance of seeing cranes in each square, so that people know where and when to look.2 It is an initiative of Koen de Koning of Wageningen University & Research and the Sensing Clues Foundation, and was part of Nature FIRST, an EU Horizon Europe research project (grant 101060954).1,2 De Koning calls it an operational eco-digital twin: a model of one living system that keeps itself in step with that system as new data arrive.2 The map is open to anyone at the Sensing Clues page.1
Cranes suit this. They migrate through narrow corridors between well-known stopover sites, where tens of thousands gather, so their movements are fairly predictable. Dutch birdwatchers also record them consistently: about a quarter of a million migration sightings were logged on waarneming.nl and observation.org between 2009 and 2024, usually with place, time, flight direction and flock size.2
The flight models rest on established theory of bird migration and flight. They were fitted to the GPS tracks of tagged cranes from Movebank and to past winds from the ERA5 weather reanalysis.2 While running, the radar fetches new sightings from the waarneming.nl and observation.org API and wind forecasts from the data platform of KNMI, the Dutch weather service.2 It keeps only cranes reported flying over, inside the study area and seen in the last thirty minutes. When a new sighting falls inside the predicted area of a flock it already tracks, the two are linked and that flock's speed and direction are re-estimated.2 The model is written in R as a Shiny web app. In the paper (published December 2024) it updates every minute, with a forecast of up to four hours for each sighting.2 The Sensing Clues page now says positions are updated every five minutes.1 For 2026 the colours were changed to be readable with colour vision deficiencies, and users can follow a flock over time and look up to an hour ahead. Birdwatchers helped design these changes in workshops over the summer, and a WhatsApp channel and online community were added for sharing sightings.3
The loop closes through people. A user who shares their location sees a notice when the radar predicts cranes nearby; when they see them and report the sighting, that sighting feeds the next update.2 De Koning describes this as a two-way flow of information between the twin and the real birds.2
The paper is frank about what was hard. The app often crashed on peak migration days and had to be restarted. It has no filter for misidentified birds or wrong times and places, and assumes every report is correct. Many birdwatchers report only when they get home, by which time the sighting is too old to help. Access to the observation API came through a personal contact with one of the platform's founders, while KNMI's forecasts need only a free account.2 There has been no quantitative test yet of whether the radar helps people see more cranes.2 The source code and the interview data are published on 4TU.ResearchData.2
Someone planning a live model of their own place can follow the paper stage by stage. It defines what success would mean, which data are needed and how to clean them, then the model, the deployment and the evaluation, with the crane radar as the example at each step.2 Digital twins as a tool for ecosystem research names it as one of three examples of twins from the life sciences.4
- place
- The Netherlands, Belgium and Luxembourg, with parts of northern France and northwest Germany
- scale
- region
- operational
- operational
- homepage
- https://sensingclues.org/craneradar
requires this data or input
-
Free database hosted by the Max Planck Institute of Animal Behavior where researchers keep, share and archive the tracks of tagged animals and readings from other sensors the animals carry.
partly open dataAPIopen participation
-
ECMWF's hourly reconstruction of the world's weather from 1940 to a few days ago, under CC BY from the Copernicus Climate Data Store; ERA5-Land is a finer land version from 1950.
open dataAPI
cited by
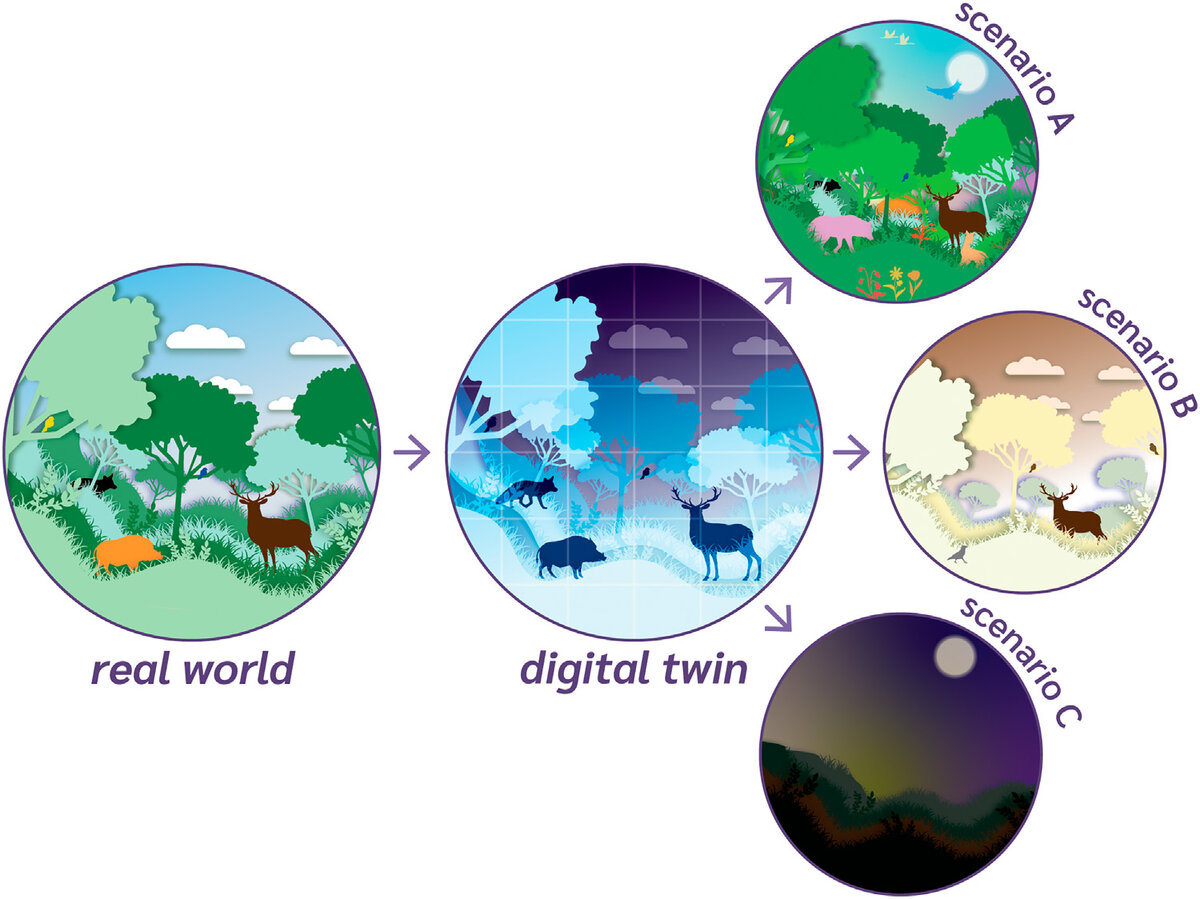
Fourteen Dutch ecologists and computer scientists set out five traits of a digital twin of an ecosystem, say why it is more than a model, and list fifteen studies partway there.
Tags: birds, bird migration, common crane, citizen science, forecasting, Netherlands