article · draft
Nature's comeback: scaling ecosystem restoration for people and planet
FAO, UNEP and the CBD Secretariat's 2026 count of restoration worldwide: 252 million hectares in 149 countries, mostly on land, against the commitments, the 30 per cent target and the money needed.
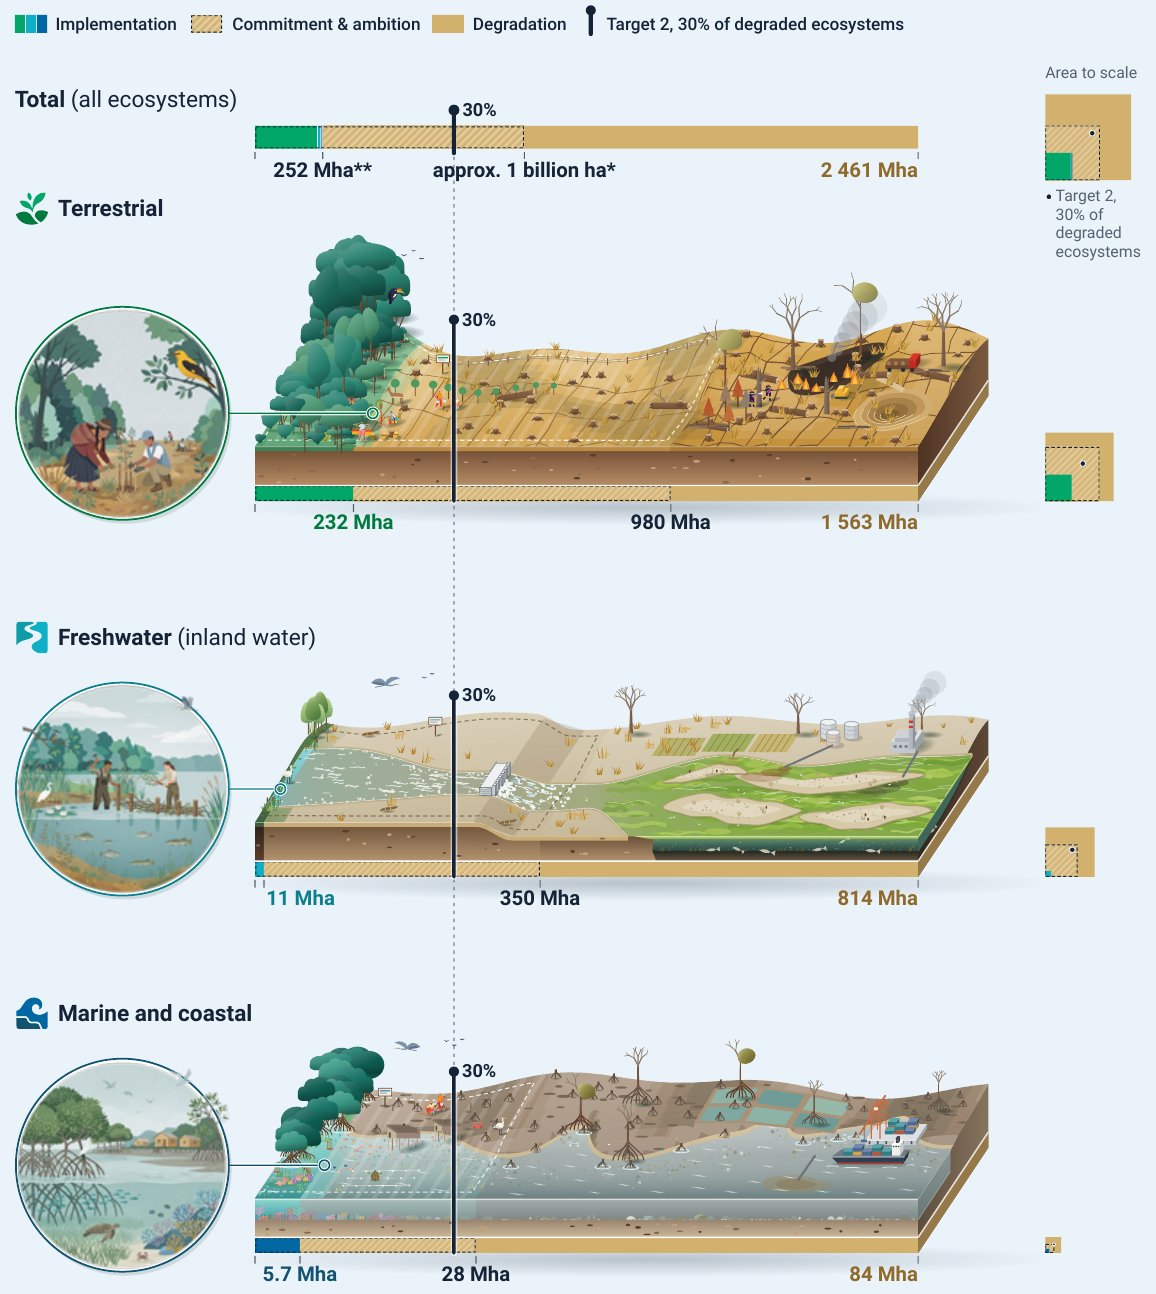
Figure 13 of the report: area under restoration, commitments, the Target 2 line and degraded area, for all ecosystems and for each realm. FAO, UNEP and SCBD 2026, CC BY-NC-SA 3.0 IGO; cropped, with the Target 2 badge removed.
The UN Decade on Ecosystem Restoration runs from 2021 to 2030, and this report takes stock at its midpoint.1 It is the first global assessment of progress against the national commitments to restore about a billion hectares.1,2 It also measures progress on Target 2 of the Kunming-Montreal Global Biodiversity Framework, which asks that by 2030 at least 30 per cent of degraded land, freshwater, and marine and coastal ecosystems be under effective restoration.1,2 The Food and Agriculture Organization (FAO), the UN Environment Programme (UNEP) and the Secretariat of the Convention on Biological Diversity (SCBD) published it on 29 October 2026 and launched it at the UN Biodiversity Conference, COP17.2 Twenty-five authors are named, nineteen of them at FAO.1
How the count was made. No single reporting process covers restoration, so the authors combined several. The area under restoration comes from four of them: FAO's Global Forest Resources Assessment 2025, countries' Seventh National Reports to the CBD, the Convention on Wetlands' site and national-report systems, and initiatives registered in FAO's Framework for Ecosystem Restoration Monitoring (FERM).1 The same hectares can turn up in several of these, and there is rarely enough mapping to find the overlap. The report therefore keeps the highest value each country reported for each ecosystem rather than adding them up. That reduces double counting but cannot remove it.1
The authors attach four warnings to their own numbers.1
- An area reported as under restoration means the work was documented. It does not show the ecosystem has recovered, or that the work meets the Target 2 guidance for effective restoration.
- Reporting is least complete for freshwater, and for marine and coastal ecosystems, so some of the gap there is missing information rather than missing work.
- Regional and country figures show where restoration is documented. They are not rankings, and should be read against each country's land area and reporting.
- The figures for degradation, commitments and restoration are not mapped onto each other, so they cannot be compared place by place.
The numbers. About 252 million hectares (Mha) in 149 countries are documented as under restoration. That is a quarter of what countries have committed, and implementation would have to triple to meet Target 2.1 The picture above is the report's Figure 13, which sets each realm's documented restoration against its commitments, the 30 per cent line and the degraded area.1
| Under restoration | Target 2 (30% of degraded) | Commitments | Degraded | |
|---|---|---|---|---|
| All ecosystems | 252 Mha | 738 Mha | about 1 billion ha | 2,461 Mha |
| Land | 232 Mha | 469 Mha | 980 Mha | 1,563 Mha |
| Freshwater | 11 Mha in 62 countries | 244 Mha | 350 Mha (Freshwater Challenge) | 814 Mha |
| Marine and coastal | 5.7 Mha in 46 countries | 25 Mha | 28 Mha (global pledges) | 84 Mha |
The total includes 3.2 Mha with no ecosystem given.1 The freshwater commitment is the Freshwater Challenge's goal for wetlands. The marine one sums the Mangrove and Coral Reef Breakthroughs and the Kelp Forest Challenge. These global pledges do not say how much each country will restore, so they stay out of the national total.1 The degraded areas for freshwater and marine ecosystems are rough estimates. The authors take 63 per cent of remaining area as degraded, for wetlands from a 2024 survey of more than 400 of them and for the sea from the midpoint of published ranges, because no global assessment of degradation exists for either.1
On land, restoration has reached nearly half the target.1,2 China reports 127.4 Mha, 54 per cent of all documented land restoration.1 Indonesia accounts for most of the freshwater figure, with about 6 Mha of peatland.1 Europe holds about 4.1 Mha of the marine and coastal figure, most of it Ireland's 3.25 Mha.1 By region, Asia has 192.2 Mha, Africa 36.3, Europe 9.1, North and Central America 5.8, South America 5.4 and Oceania 3.2; the report and the UNEP release both say these reflect land area and monitoring capacity as well as activity, and are not a ranking.1,2
Water and coasts are undercounted. Freshwater and marine ecosystems are degrading fastest and have the least documented restoration.1 Some of that is how they are measured. A river may be restored by length rather than area, a catchment project may mix land and water without splitting the area, and underwater monitoring is costly.1 Only four FERM initiatives gave a marine or coastal restoration area, about 97,600 hectares between them.1 The report expects aquatic restoration to be underestimated.1,2 Reporting is rising: since COP14 of the Convention on Wetlands in 2022, the share of Parties reporting wetland restoration or rehabilitation programmes in place has gone from 8 to 54 per cent.1,2
Who did not report. Forty-six countries gave no quantitative restoration figures under any framework, and 26 of them have commitments totalling 53 Mha.1 Of 125 countries that had sent Seventh National Reports to the CBD by March 2026, 63 gave no area under Target 2; asked why, 38 said they had no national-level data.1 Countries also read "area under restoration" differently: in the forest assessment some reported trees planted, or planned, rather than an area.1
Money. Traceable finance for restoration was about US$64 billion in 2022, nearly three-quarters of it public. Most public money was domestic spending on sustainable agriculture, forestry and fishing, and five countries, China, the United States, Canada, Japan and Türkiye, accounted for 76 per cent of public spending in those sectors.1 Development aid aimed at restoration was US$1.2 billion.1 Meeting the 2030 targets needs about US$296 billion a year, more than four times as much, and US$448 billion a year by 2050.1 The largest needs by 2030 are agroforestry at US$87 billion a year, restorative reforestation at 52, peatlands at 44 and seagrass at 28.1 Investors told the authors that the cost of ecological monitoring, and of correcting poor results afterwards, holds them back.1
Jobs and flagships. The 35 UN World Restoration Flagships report 18 Mha under restoration through FERM. They are linked to more than 1.1 million jobs and more than 1.2 million people trained, and to the return of species including mountain gorillas in East Africa, snow leopards in Kyrgyzstan and Ganges river dolphins in India.1 An estimate in the report puts the potential at more than 32 million new jobs by 2030.1 At the launch five more flagships were named: the Blue Bay Restoration Initiative in China, Urban Nature Reborn in Colombia, Ethiopia's Great Rift-Valley Renaissance, Forestami in Milan, and the Green Seattle Partnership.2,3,4,5,6,7 A box in the report on the wider Milan area, drawn from Forestami, gives its target of 3 million native trees by 2030 and says early monitoring has recorded a rise in the diversity of pollinators.1
For someone modelling a place. The report's central point for monitoring is that hectares are not recovery. Area under restoration, the Target 2 indicator, does not show whether biodiversity is returning, whether ecosystem functions and connectivity are improving, or whether people benefit; the authors ask for ecological, socioeconomic and cultural indicators suited to each ecosystem and to the aims of the work.1 They also note that where restoration happens, and where it is planned, is often not mapped, because commitments and progress are reported as national totals.1 The spatial planning tools they list, Earth Map, UN Biodiversity Lab, WePlan Forests and se.plan, focus on land and mostly on trees, and the report names tools for water as a gap.1 Where the work is, what was done and what changed are the things national totals leave out and a model of one watershed or coast holds. Saint Lucia is the report's example of a country gathering such data: it found its restoration information scattered across agencies and projects, and plans a baseline database and a national FERM dashboard.1
The report is published under CC BY-NC-SA 3.0 IGO, so its figure can be shown here.1
- url
- https://doi.org/10.4060/ce2114en
- published
- 2026-10-29
- publisher
- FAO, UNEP and Secretariat of the Convention on Biological Diversity (Rome)
- authors
- FAO, UNEP, SCBD
refers to this entry as a source
-
FAO's free registry of ecosystem restoration initiatives, with their mapped areas, activities and indicators; the official monitor of the UN Decade on Ecosystem Restoration.
partly open datapartly open participation
-
FAO's free database of food and agriculture statistics for over 245 countries and territories from 1961, from crops and trade to fertiliser and land use, under CC BY 4.0.
open dataAPI
is about this entity
-
The global biodiversity agreement adopted under the Convention on Biological Diversity in December 2022: four goals for 2050, twenty-three targets for 2030, and a commitment by each Party to set national targets.
helps answer this question
-
If land changes use, farm to housing, forest to pasture, floodplain to park, what happens to water, habitat, carbon and food?
Tags: ecosystem restoration, Target 2, UN Decade on Ecosystem Restoration, wetlands, restoration finance, monitoring, report