data source · draft
IUCN Red List of Threatened Species
IUCN's ranking of how close more than 175,900 species are to extinction, with range maps; free for conservation and research, not for commercial use or redistribution without permission.
What is reusable: unknown sourcerestricted dataAPIunknown participation IUCN Red List Terms and Conditions of Use v3.1: conservation, education, scientific analysis and research only; no commercial use and no reposting or redistribution without IUCN's written permission
The International Union for Conservation of Nature (IUCN) established the Red List in 1964.2 It covers animals, fungi and plants.2 Beyond each species' status, it gives information on range, population size, habitat, use and trade, threats and conservation actions.2 The assessments are compiled by IUCN staff, partner organisations and experts in the IUCN Species Survival Commission; there are 13 Red List Partner organisations.2,5
Each species is placed in one of nine categories: Extinct, Extinct in the Wild, Critically Endangered, Endangered, Vulnerable, Near Threatened, Least Concern, Data Deficient and Not Evaluated.5 The three from Vulnerable to Critically Endangered count as threatened with extinction.5 Version 2026-1 holds more than 175,900 species, more than 49,500 of them threatened, including 44% of reef-building corals, 41% of amphibians, 26% of mammals and 11.5% of birds.1,2 IUCN aims to raise the number assessed to at least 260,000.2 Two measures are built on the list: the Red List Index, which governments use to track trends in extinction risk against their targets, and the Green Status of Species, which measures how far a species' populations have recovered.5
Range maps are published for most comprehensively assessed groups and some freshwater groups; the spatial data page, as archived in May 2026, says more than 88% of assessed species have spatial data.4 They come as polygons of each species' known range in Esri shapefile format (sometimes incomplete), as CSV tables of point observations, and, for freshwater species, as tables keyed to HydroBASINS river and lake catchments.4 Data Deficient species are not mapped, and bird ranges are held by BirdLife International and requested from its own site.4 Version 4 of the API needs a token.3 IUCN says it is meant mainly for conservation work in education and research, and may restrict uses such as app development or visualisations unrelated to conservation.3 Its data change with each Red List version, and IUCN asks frequent users to cache them, after asking permission, and refresh at each update.3
The data are not openly licensed. Under the Terms and Conditions of Use (version 3.1, June 2024), anyone may view and query the site, and the category given to each named species may be used without restriction.1 Beyond that, users may use, download and print the data without asking only for conservation, education or research, including scientific analysis.1 Commercial use of the data, or of any work derived from them, needs IUCN's prior written permission; commercial means any use by or to assist a for-profit entity, or use by an individual or non-profit to generate revenue.1 Reposting or redistributing the data, whole or in part, alone or combined with other data, through downloads, APIs, web maps that allow downloads or any other means, is prohibited without a written waiver, and since 2017 that includes derivative works.1 Users must cite the version used, should not use a superseded version except for specific analyses, and must send IUCN a copy of anything published with the data.1 For commercial use IUCN points to the Integrated Biodiversity Assessment Tool (IBAT).3,4
For someone modelling a place, the range maps show which assessed species are known to occur in an area and how threatened each is.2,4 That helps in judging what a change of land use would put at risk. A range map outlines where a species is known to occur. Records of individual sightings are in GBIF and iNaturalist. A tool or public site that lets others download or view the Red List's data needs IUCN's written permission first.1
- coverage
- global; more than 175,900 species assessed (version 2026-1)
- resolution
- species; range polygons, point observations and freshwater catchment tables for many groups
- cadence
- a new version at each Red List update (2026-1 current when read); spatial data last updated 10 October 2025
- access
- free website search; spatial data downloads; API v4 with a token; non-commercial use only, commercial access through IBAT
- format
- Esri shapefile polygons, CSV points and HydroBASINS tables; JSON from the API
- homepage
- https://www.iucnredlist.org/
helps answer this question
-
If land changes use, farm to housing, forest to pasture, floodplain to park, what happens to water, habitat, carbon and food?
needed by
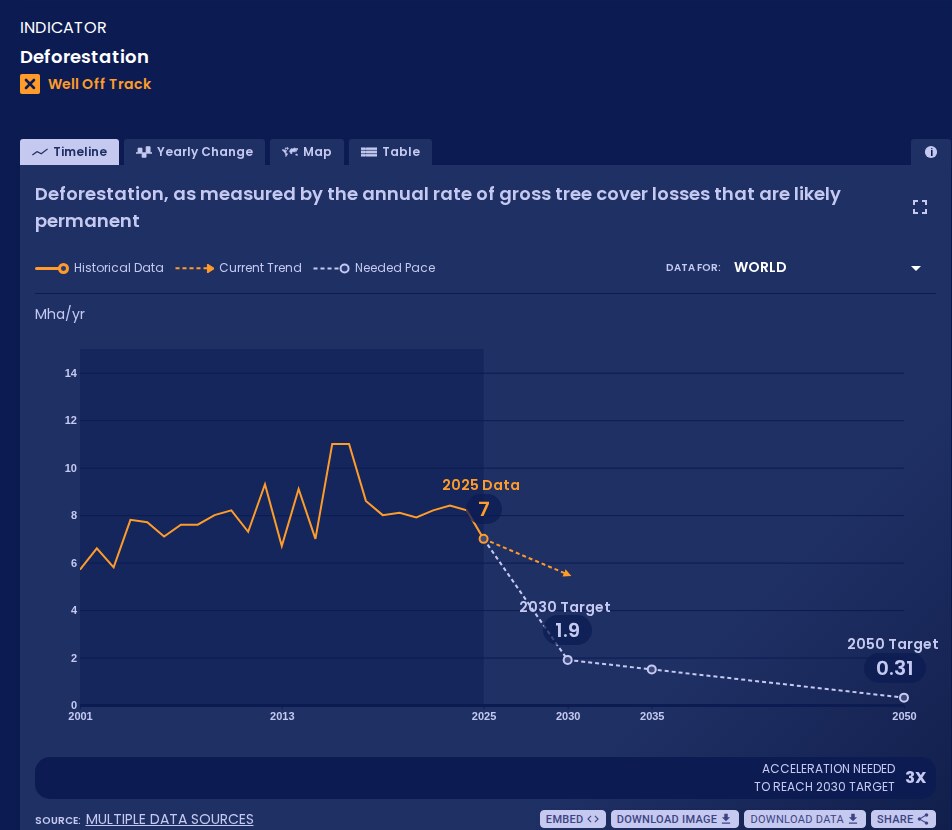
WRI and Bezos Earth Fund platform that measures global progress on more than 70 shifts, from power to forests, against targets for 2030 and 2050; data free under CC BY 4.0.
open data
Tags: biodiversity, species, extinction risk, threatened species, range maps, conservation