data source · draft
Systems Change Lab
WRI and Bezos Earth Fund platform that measures global progress on more than 70 shifts, from power to forests, against targets for 2030 and 2050; data free under CC BY 4.0.
Living systemsWeather & climate
What is reusable: unknown sourceopen dataAPI unknownunknown participation CC BY 4.0 for Systems Change Lab's own data, maps and charts; third-party data keep their own licences
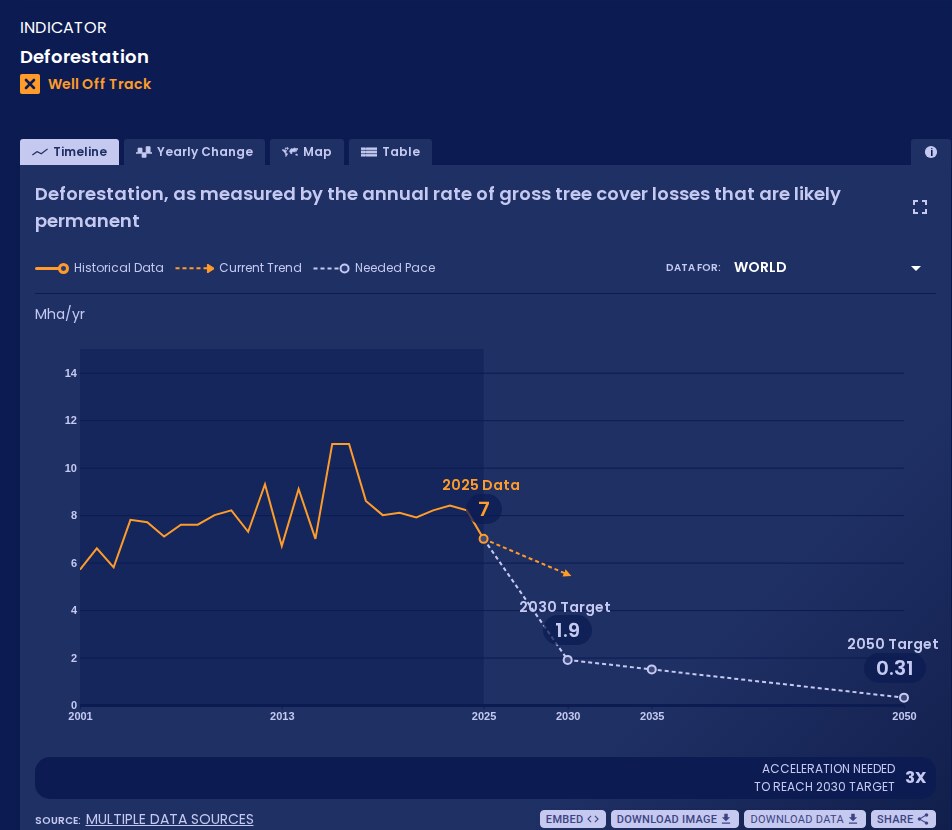
Deforestation indicator for the world, 2001 to 2025, with the current trend and the pace needed for the 2030 and 2050 targets, from the indicator page. Systems Change Lab, CC BY 4.0.
Systems Change Lab tracks more than 70 shifts that its makers say are needed to limit warming to 1.5°C, halt biodiversity loss and build a just economy.1,2 For each it compares current action with targets for 2030 and 2050.1 It is convened by the World Resources Institute (WRI) and the Bezos Earth Fund and is a component of the Global Commons Alliance.1 Nine other founding partners include Climate Action Tracker, the ClimateWorks Foundation and the Global Environment Facility.1 The project team is led by two co-directors, Rachel Jetel of WRI and Kelly Levin of the Bezos Earth Fund.1
The shifts are grouped by system: power, industry, transport, cities, buildings, technological carbon removal, forests and land, ocean, freshwater, food and agriculture, finance, circular economy, economics and governance.3,11 Each shift has outcome indicators, the measurable results it should produce.14 Enabler and barrier indicators track the conditions, such as regulations, institutions and behaviour, that speed or block a shift.14 Outcome indicators are judged against global targets drawn from the scientific literature, and each falls in one of six categories:13,14
- on track
- off track
- well off track
- right direction, no target
- wrong direction
- insufficient data
To judge an indicator, the method extends a straight-line trend from recent years to 2030 and compares it with the rate of change the target needs.15 The trend usually spans five years of data, and ten for most forest indicators, whose values swing from year to year.5,15 Progress is assessed only for the world as a whole, because national targets are not available for most indicators; national figures are shown where data exist.14
Forests and land
The forests and land system covers forests, peatlands, grasslands, savannas, shrublands and coastal wetlands.3,4 Its methodology names six shifts:13
- halt deforestation, other conversion and degradation
- restore deforested and degraded ecosystems
- manage ecosystems sustainably to cut emissions and increase carbon removal
- sharply reduce pollution
- halt the overexploitation of wild species
- slow the spread of invasive alien species
The last of these is not yet online, as its research is still under way.3
In a news article of 19 October 2026, the lab reported that none of the system's 26 outcome indicators was on track for its 2030 targets.8,16 Seven were moving in the right direction. Three of them, deforestation, reforestation and mangrove restoration, are moving too slowly.8 Four others, such as forest degradation and salt marsh restoration, have no 2030 target to measure against.8 Eight were heading the wrong way, including primary forest loss, extinction risk for overexploited species and the conversion of grasslands, savannas and shrublands.8 Eleven lacked the data to judge, including the restoration of degraded peatlands, heavy metal contamination and fire management.8 The same research tracks more than 65 enabler and barrier indicators, such as protected areas, land rights for Indigenous Peoples and local communities, deforestation rules in supply chains and finance for conservation.8
The first shift, halting conversion and degradation, has nine outcome indicators, shown on its page as follows (Mha is million hectares):4
| Indicator | Latest world value | Status |
|---|---|---|
| Deforestation | 7 Mha/yr (2025) | well off track |
| Primary forest loss | 7.7 Mha/yr (2025) | wrong direction |
| Forest loss in Key Biodiversity Areas | 2 Mha/yr (2025) | right direction, no target |
| Forest degradation | 63 Mha (2022) | right direction, no target |
| Forest degradation due to fire | 11 Mha/yr (2025) | wrong direction |
| Peatland degradation | insufficient data | |
| Mangrove conversion | 32,000 ha/yr (2019) | wrong direction |
| Salt marsh conversion | 5,400 ha/yr (2019) | wrong direction |
| Grassland, savanna and shrubland conversion | 18 Mha/yr (2024) | wrong direction |
Deforestation here means tree cover loss that is likely permanent: the change from forest to farmland, mines, settlements or other uses.5 The target is 1.9 Mha a year by 2030, 1.5 by 2035 and 0.31 by 2050.5 The indicator page, with data updated 20 October 2026, says the rate fell from a record 11 Mha a year in 2017 to 7.0 in 2025, with a rise to 8.4 in 2023.5 To reach the 2030 target, it says, the decline must go three times faster.5 The State of Climate Action 2025 report, published the year before, called for deforestation to be reduced nine times faster.15 Primary forest loss rose by an average of 0.15 Mha a year between 2016 and 2025, with 75 Mha lost over those ten years, about 60% of it in humid tropical primary forests.6 Mangrove losses grew by almost 950 ha a year between 2008 and 2019, against a target of no more than 4,900 ha a year by 2030 for the climate and zero by 2030 for biodiversity.7
Of the other shifts, reforestation is well off track.9 Tree cover gain, the best available proxy, covered 49 Mha between 2010 and 2020.9 It must at least double to reach the targets of 100 Mha by 2030, 150 Mha by 2035 and 300 Mha by 2050.9 All three indicators of sustainable management (forests, forest fire, and grasslands, savannas and shrublands) lack the data to judge.17 Both overexploitation indicators, extinction risk for overexploited species and illegal wildlife trade, are heading the wrong way.8,10
Where the forest data come from
Each indicator has an information panel listing its sources, definitions and data problems.14 The deforestation indicator combines three datasets on Global Nature Watch.5 They are the Hansen tree cover loss maps, updated to the latest year; tree cover loss by dominant driver, from Sims et al. 2025; and the extent of humid tropical primary forest, from Turubanova et al. 2018.5 It counts loss where the dominant driver is permanent agriculture, mining and energy infrastructure, or settlements and infrastructure, plus shifting cultivation inside humid tropical primary forest; logging, wildfire and other natural disturbance are left out as likely temporary.5 The panel lists the limits: the driver data are at 1 km, the loss data may miss small clearings, accuracy varies by biome, and the loss data have changed method over time, though little since 2015.5 Primary forest loss draws on the same tree cover loss data, using intact forest landscapes as a stand-in for temperate and boreal primary forest, which has no complete map.6 Mangrove conversion uses Murray et al.'s maps of tidal wetland losses and gains.7 Extinction risk counts terrestrial species threatened by biological resource use on the IUCN Red List, and illegal trade counts incidents in TRAFFIC's Wildlife Trade Portal.10 Other indicators in the system draw on FAOSTAT, for drained organic soils, and the Forest Landscape Integrity Index.4
Getting the data
Each chart has a Download Data button.14 The download page lists indicators with their system, shift and last update, and all downloadable data also come as one file.11 Opened on 26 October 2026, the full file was a ZIP of CSV files, a data file and a metadata file for each indicator.11 Not everything shown is downloadable.11 International Energy Agency data, for one, fall under the IEA's own terms and are not offered.12 Questions about bulk data go to data@systemschangelab.org.11 Updates come on a rolling annual basis, as partners release new data.14
Data, maps and charts made by Systems Change Lab are licensed CC BY 4.0, for any use with credit to Systems Change Lab, and without implying endorsement by it, WRI, the Bezos Earth Fund or partners.12 The suggested citation is "Systems Change Lab. 2025. Washington, DC: World Resources Institute, Bezos Earth Fund."12 Data from other providers keep their own licences, which the lab asks users to confirm at the source; photographs on the site are not covered by CC BY.12 The site's code is published on GitHub under the MIT licence.12
Method and reports
The methodology page explains, system by system, how shifts, targets and indicators were chosen; it links a technical note, updated in 2025, with 2024 and 2022 versions also available.13 Parts of the note come from the method of the State of Climate Action series, which covers a climate-only subset of the same targets.13 The State of Climate Action 2025 report was published under Systems Change Lab by five of its partners.15 It found that none of its 45 indicators was on track for 2030.15
Using it to model a place
Someone modelling a forest, watershed or region can use the lab's targets and trend lines as the global yardstick: how fast deforestation, mangrove loss or reforestation would have to change to match 1.5°C and biodiversity goals, and where the world stands now.5,9 Where national series exist, the downloads give a country's own history against which local land-use scenarios can be set, though the lab judges progress only for the world.11,14 For the underlying pixels, the information panels lead back to the source datasets, such as the Hansen maps and Global Nature Watch.5
- coverage
- global, with national data where available
- cadence
- rolling annual updates as source data are released; forests and land indicators updated September and October 2026
- access
- free; per-indicator downloads from each chart and one ZIP of all downloadable data from the download page
- format
- interactive charts and maps; CSV files, each with a metadata file
- homepage
- https://systemschangelab.org/
helps answer this question
-
If land changes use, farm to housing, forest to pasture, floodplain to park, what happens to water, habitat, carbon and food?
requires this data or input
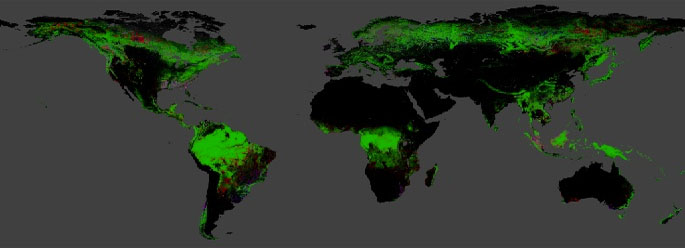
The University of Maryland's global 30 m maps of tree cover in 2000 and of the year forest was lost since, from Landsat imagery; updated yearly, free under CC BY 4.0.
open dataAPI
Website from the World Resources Institute, called Global Forest Watch until 2026, that publishes free global data, maps and alerts on forests and is widening to grasslands and farmland.
open data
-
FAO's free database of food and agriculture statistics for over 245 countries and territories from 1961, from crops and trade to fertiliser and land use, under CC BY 4.0.
open dataAPI
-
IUCN's ranking of how close more than 175,900 species are to extinction, with range maps; free for conservation and research, not for commercial use or redistribution without permission.
restricted dataAPI
Tags: indicators, targets, deforestation, forests, climate action, biodiversity, progress tracking