organization · draft
Integrated Global Greenhouse Gas Information System (IG3IS)
WMO initiative that estimates greenhouse gas emissions and removals for countries, cities and facilities from atmospheric measurements and models, and writes good-practice guidelines for doing so.
Weather & climateCities & places
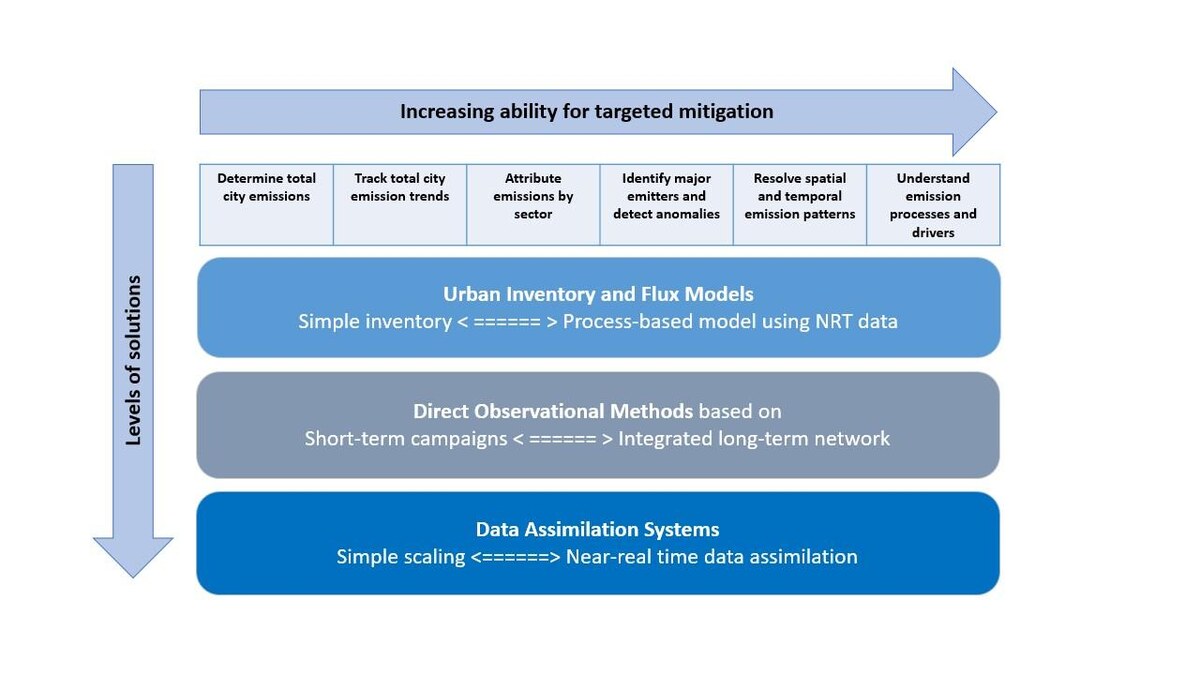
Levels of solutions for urban greenhouse gas information, from the IG3IS methodologies page. WMO; figures on its sites may be reproduced with the source acknowledged.
The Integrated Global Greenhouse Gas Information System (IG3IS) is an initiative of the Global Atmosphere Watch (GAW) programme of the World Meteorological Organization (WMO) for estimating greenhouse gas emissions and removals from measurements of the atmosphere.1,2 It aims to give governments, cities and other users the best possible estimates at the scales where they make decisions, and to set down good practice for doing so.2 IG3IS is not designed to check compliance with regulations.2 WMO began developing it in 2013; the 17th World Meteorological Congress asked for a plan in 2015, and WMO's Executive Council approved its implementation plan in 2018.3 The IPCC's 2019 Refinement to its 2006 guidelines for national inventories refers to it in the section on inventory quality control.3 A Steering Committee coordinates the work with support from the WMO Secretariat, and a stakeholder group formed in 2020 brings in users; its listed members come from WWF Cities, WRI Mexico and the state environment agency of Pernambuco in Brazil.6 Coordination is supported by the Swiss Confederation through MeteoSwiss and by NASA.16,19
Emissions have usually been estimated by inventory: national statistics such as oil consumption or vehicle numbers, multiplied by emission factors.4,7 IG3IS starts from the air instead. Measurements of a gas from the ground, aircraft and satellites go into an atmospheric inverse model.7 The model starts from a first guess of the emissions, built from socioeconomic data and known natural fluxes, carries them on winds from a weather model, and adjusts them until the modelled concentrations match those measured.7 Telling one source from another can need extra measurements of gases emitted alongside, or of isotopes.7 The results are meant to complement inventories, and they count natural as well as human emissions and removals.7 Australia, Germany, New Zealand, the Republic of Korea, Spain, Switzerland and the United Kingdom have used such analyses to improve their national inventory reports.4 WMO's Greenhouse Gas Bulletin points to IG3IS for sources and sinks at national and especially city scale.21
Its objectives name three scales: national, to help inventory managers reduce the uncertainty of their reports; sectoral, for sectors whose emissions are poorly known, such as agriculture, land use and forestry, waste and methane leaking from industry; and urban.5 For cities and other subnational bodies the aim is information on sources and sinks at the spatial, temporal and sectoral detail they need.5 The use cases it lists include whole-city totals, trends, emissions by place, time and sector, and how emissions relate to air quality and to the exchange of gases with vegetation.5 WMO notes that urban areas cover a small part of the Earth's surface but account for roughly 70% of global greenhouse gas emissions.17
The urban guidelines first appeared in 2022.3 The 2025 edition, published as GAW Report No. 314, came out in October 2025.16,20 Its first part sets out core principles, the actions a city might take, what stakeholders need and the methods available, for readers new to the subject; its second part describes 31 techniques in detail for those who will carry them out.16 It concentrates on carbon dioxide and methane, though many of the methods also apply to nitrous oxide and the fluorinated gases.9 The draft was finished at the Urban Greenhouse Gas Conference and Stakeholder Summit at WMO in Geneva on 7 to 9 April 2025, co-hosted with the ICOS Cities project of Europe's Integrated Carbon Observation System.17 Jocelyn Turnbull, co-chair of the Steering Committee and lead author, called the guidelines the first step towards documentary standards that let cities and researchers show their emissions information is robust.16,20 National guidance, GAW Report No. 319, followed in December 2025, in four sections: a non-technical overview, technical design, quality control and interpretation, and examples of systems running in different parts of the world.10,19 Guidelines for methane from individual facilities and for carbon dioxide at landscape scale, with a focus on forestry, are being written.8
The endorsed projects and the pilot on the IG3IS and WMO pages are mostly national, and some reach down to cities.
- INVERSE-Korea, led by the Ecosystem-Atmosphere Process Laboratory at Yonsei University, estimates carbon dioxide, methane and sulphur hexafluoride emissions across the Korean Peninsula with the WRF-Chem weather and chemistry model and the DART data assimilation system. Its phases from 2021 to 2026 work at city scale, and it plans to draw on flux measurements in the Seoul metropolitan area and observations from the 555 m Lotte World Tower.13
- RESPIRE-CLIMATE, coordinated by the Barcelona Supercomputing Center and AEMET, Spain's meteorological agency, is building a national monitoring system for carbon dioxide and methane.14 It makes inventory-based emission maps down to 1 km and daily estimates of combustion emissions available within three months, is setting up a national measurement network to check them against, and serves maps for regions, provinces and metropolitan areas through a portal, downloadable as CSV and NetCDF.14
- ITMS, Germany's Integrated Greenhouse Gas Monitoring System, is building a demonstrator from 2022 to 2026 for carbon dioxide, methane and nitrous oxide that the Deutscher Wetterdienst can run as a service, including the identification of regional hotspots.12
- A pilot in Anji County, China, from March 2022 to March 2027, uses two measurement towers and inverse modelling to estimate how much carbon dioxide a bamboo forest takes up; measurements began in August 2023.15
At the April 2026 user summit in Geneva, solutions from New Zealand, Switzerland, Canada, Spain, Germany and the ICOS Cities project were on show, and participants from 14 countries worked on climate-finance proposals that would use these methods.18
What a city or region needs depends on its question. The figure above, from the methodologies page, sets six questions against three kinds of tool.7 The questions run from a whole-city total to the processes that drive emissions. Each tool ranges from simple to complex: inventories and flux models go from a simple inventory to a process model fed with near-real-time data, direct measurement from short campaigns to a permanent network, and data assimilation from simple scaling to near-real-time assimilation.7 At national scale the tiers run from a single monitoring station to high-resolution modelling with local experts.7 Turnbull has said every city will need a slightly different set of measurements, chosen for its size, geography and climate, the information it wants and the resources and skills it has.20 Case studies at the 2026 summit showed gaps in infrastructure, people, long-term funding and the link between science and policy.18 A project can ask the Steering Committee for endorsement by sending the WMO Secretariat a PDF of up to ten pages; applications are reviewed quarterly, a decision comes within three months, and endorsement brings no funding.11
For a city or region building a model of its own carbon, the urban guidelines set out the methods for checking an inventory against the air, and the endorsed projects show what a working system is made of. Long-running station records of the gases are archived at the World Data Centre for Greenhouse Gases.
- form
- initiative of WMO's Global Atmosphere Watch programme
- homepage
- https://ig3is.wmo.int/site/integrated-global-greenhouse-gas-information-system-ig3is
contributes to this work
-
Treaty under the UN climate convention, adopted in 2015: hold warming well below 2 °C and aim for 1.5 °C, through national pledges every five years, common reporting and a global stocktake.
cited by
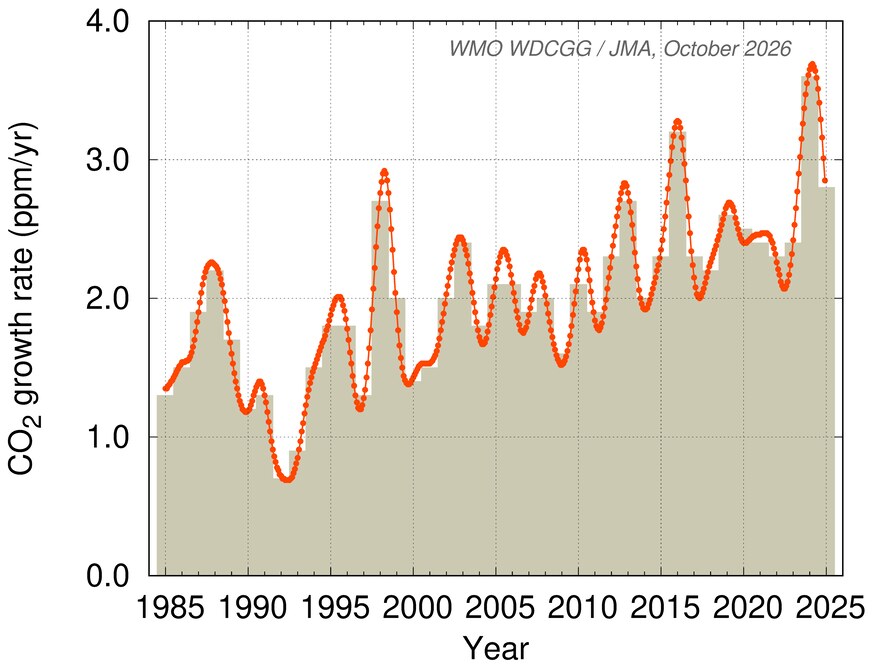
The World Meteorological Organization's report on greenhouse gases in the air in 2025, when carbon dioxide averaged 426.8 ppm and methane and nitrous oxide also reached new highs.
Tags: greenhouse gases, emissions, cities, inverse modelling, emission inventories, good practice, Global Atmosphere Watch