article · draft
WMO Greenhouse Gas Bulletin No. 22
The World Meteorological Organization's report on greenhouse gases in the air in 2025, when carbon dioxide averaged 426.8 ppm and methane and nitrous oxide also reached new highs.
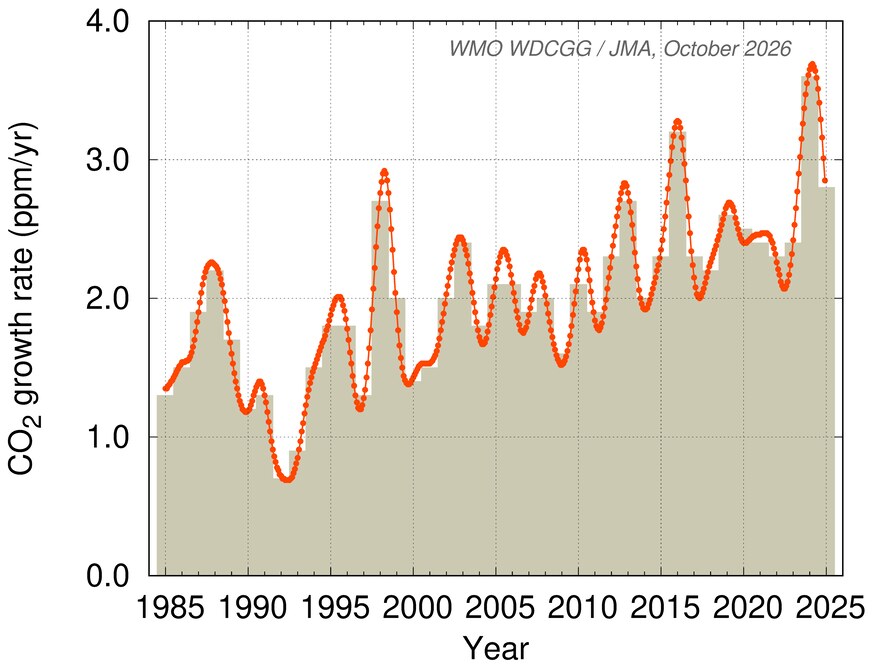
Growth rate of globally averaged carbon dioxide, 1985 to 2025 (line), with the increase in each annual mean over the year before (columns). WMO WDCGG/JMA, October 2026, from the figures for WMO Greenhouse Gas Bulletin No. 22; free to use with a citation.
WMO has published a Greenhouse Gas Bulletin every year since 2006, reporting how much of the main long-lived greenhouse gases (carbon dioxide, methane and nitrous oxide) is in the atmosphere and how fast it is changing, with a summary of the other gases.4 No. 22, published on 27 October 2026, covers measurements to December 2025 from the in-situ network of WMO's Global Atmosphere Watch (GAW) programme.1,2 It reports concentrations, the gas that has built up in the air, not each year's emissions.3 WMO times it to inform negotiators at the UN climate conference, in 2026 COP31 in Antalya, Türkiye, from 9 to 20 November.3 The World Data Centre for Greenhouse Gases (WDCGG) at the Japan Meteorological Agency keeps the station data and computes the global means.2
| Carbon dioxide | Methane | Nitrous oxide | |
|---|---|---|---|
| Global mean, 2025 | 426.8 ± 0.2 ppm | 1948 ± 2 ppb | 339.1 ± 0.1 ppb |
| Share of the 1750 level | 153% | 267% | 126% |
| Rise from 2024 | 2.8 ppm | 6 ppb | 1.1 ppb |
| Average yearly rise, 2016 to 2025 | 2.63 ppm | 10.2 ppb | 1.08 ppb |
| Stations used | 180 | 172 | 124 |
Concentrations are given as parts per million (ppm) or per billion (ppb) of dry air, and the ranges are 68% confidence limits.2 The pre-industrial levels used are 278.3 ppm, 729.2 ppb and 270.1 ppb.2
Carbon dioxide accounts for about 66% of the warming effect of the long-lived greenhouse gases since 1750, and about 83% of its increase over the last ten years.2 Its rise from 2024 to 2025 was smaller than the record 3.6 ppm of 2023 to 2024 but a little above the ten-year average.2 The Bulletin says the gentler rise probably reflects land sinks recovering and less carbon released by fires in 2025.2 WMO's senior scientific officer Oksana Tarasova said the strong El Niño of 2023 to 2024 had weakened the biosphere's uptake through drought, drier vegetation and more wildfires, and that she expects concentrations to rise further in 2026 from fossil fuel burning and a powerful El Niño now developing.3 WMO also says the yearly rise has tripled since the 1960s, from 0.8 ppm a year then to 2.4 ppm a year over 2011 to 2020.3
On sinks, the Bulletin cites the Global Carbon Budget 2025. Of the carbon dioxide emitted by people from 2015 to 2024, about 50% stayed in the atmosphere, about 29% went into the ocean and about 21% into the land, and the budget balanced to within 0.1%.2 The share that stays in the air changes from year to year with the natural swings of the sinks, mostly those on land, but the Bulletin finds little evidence that the share is trending up or down.2 WMO adds that the risk of the ocean taking up less carbon dioxide is growing.3
Methane rose by 6 ppb, less than the 8 ppb of the year before and less than the ten-year average.2 Its growth fell from about 12 ppb a year in the late 1980s to near zero between 1999 and 2006, and it has been rising again since 2007.2 About 35% of methane comes from natural sources such as wetlands and termites and about 65% from human ones such as livestock, rice, fossil fuel extraction, landfills and biomass burning.2 Unlike carbon dioxide, human methane is not mainly from fossil fuels; farming and waste matter a great deal.2 One of the Bulletin's two feature articles looks at the ratio of carbon isotopes in methane, which differs by source. After falling since 2007, the ratio rose from mid-2023 to the end of 2024, then began falling again in 2025.2 The Bulletin's most likely explanation is more methane from biomass burning, in a period of record fires in North America and the Amazon, and slightly less from wetlands in the heat and drought that drove those fires.2
Nitrous oxide accounts for about 6% of the warming effect of the long-lived gases.2 Its rise from 2024 to 2025 equalled the year before and was close to the ten-year average.2 About 65% comes from natural sources and 35% from human ones; human emissions, mainly from nitrogen fertiliser on farmland, have risen 30% over forty years to 7.3 (4.2 to 11.4) teragrams of nitrogen a year.2
NOAA's Annual Greenhouse Gas Index puts the warming effect of all the long-lived gases in 2025 at 56% above 1990 and 1.2% above 2024, with carbon dioxide accounting for about 81% of the rise since 1990.2 CFCs and other halogenated gases add about 12%; CFCs are falling while some of their replacements, HCFCs and HFCs, are rising fast from small amounts.2 The other feature article covers two gases tied to electricity. Sulphur hexafluoride, used to insulate high-voltage switchgear, rose from 3.5 parts per trillion in 1995 to 12.24 in 2025, lasts up to 3,200 years in the atmosphere and traps about 24,300 times as much heat as carbon dioxide over a century.2 Hydrogen rose from 532 ppb in 2010 to 560 ppb in 2024; it is not itself a greenhouse gas, but it reacts with the hydroxyl radicals that clean the air and so can lengthen the life of methane.2
On method, the global means use only stations calibrated to WMO's scales, after screening, by the method of GAW Report No. 184, and are updated each year and sometimes revised afterwards.4 They differ slightly from NOAA's global means for the same year because of differences in stations, averaging and the period the values represent.2 The networks for nitrous oxide and the other long-lived gases are much sparser than for carbon dioxide and methane, and tropospheric ozone, though comparable in effect to the halocarbons, varies too much from place to place for this network to give a reliable global mean.2 The warming shares count only the direct effect of carbon dioxide and methane, not the indirect effects of methane's chemistry that the IPCC's Sixth Assessment includes.2
The Bulletin's numbers describe the background air of the whole planet, so a model of one place takes them as the backdrop and the trend, not as local values. WDCGG publishes the annual and monthly global means behind them as CSV files that can be used freely with a citation.4 For sources and sinks at the scale of a country or, especially, a city, the Bulletin points to WMO's IG3IS.2
- url
- https://wmo.int/resources/publication-series/greenhouse-gas-bulletin/no-22
- published
- 2026-10-27
- publisher
- World Meteorological Organization (Geneva)
- authors
- H. Chen, A. Crotwell, A. Jordan, C. Labuschagne, X. Lan, S. Lee, I. Luijkx, S. Englund Michel, J. Miller, G. Pétron, M. Sasakawa, P. Sperlich, O. Tarasova, K. Tsuboi, A. Vermeulen, T. Warneke, R. Weiss, C. Yver
refers to this entry as a source
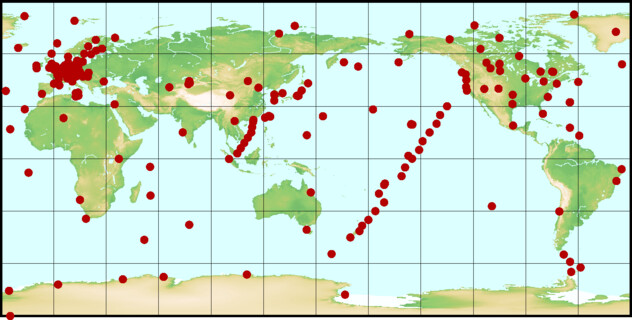
The Japan Meteorological Agency's archive, run for WMO, of greenhouse gas measurements from stations, ships and aircraft worldwide, and the source of the global means in WMO's yearly Bulletin.
open datapartly open participation
-
NOAA Global Monitoring Laboratory's record of atmospheric carbon dioxide at Mauna Loa Observatory since 1974, as daily, weekly, monthly and annual means, with a global mean series.
open data
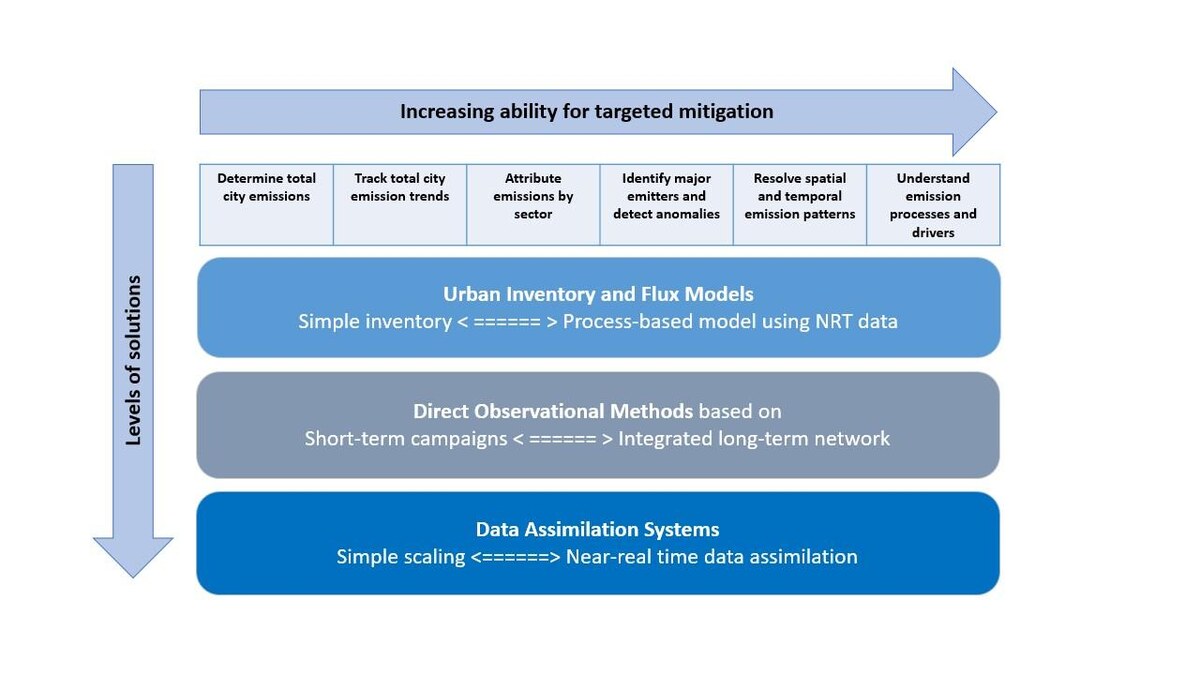
WMO initiative that estimates greenhouse gas emissions and removals for countries, cities and facilities from atmospheric measurements and models, and writes good-practice guidelines for doing so.
helps answer this question
-
What weather is coming this week, and how will the climate of this place change over the coming decades?
Tags: carbon dioxide, methane, nitrous oxide, greenhouse gases, carbon sinks, Global Atmosphere Watch, report