article · draft
California's Fifth Climate Change Assessment: Statewide Summary
The State of California's 2026 summary of its fifth climate assessment, built on CMIP6 projections downscaled to a 3 km grid and read across nine regions.
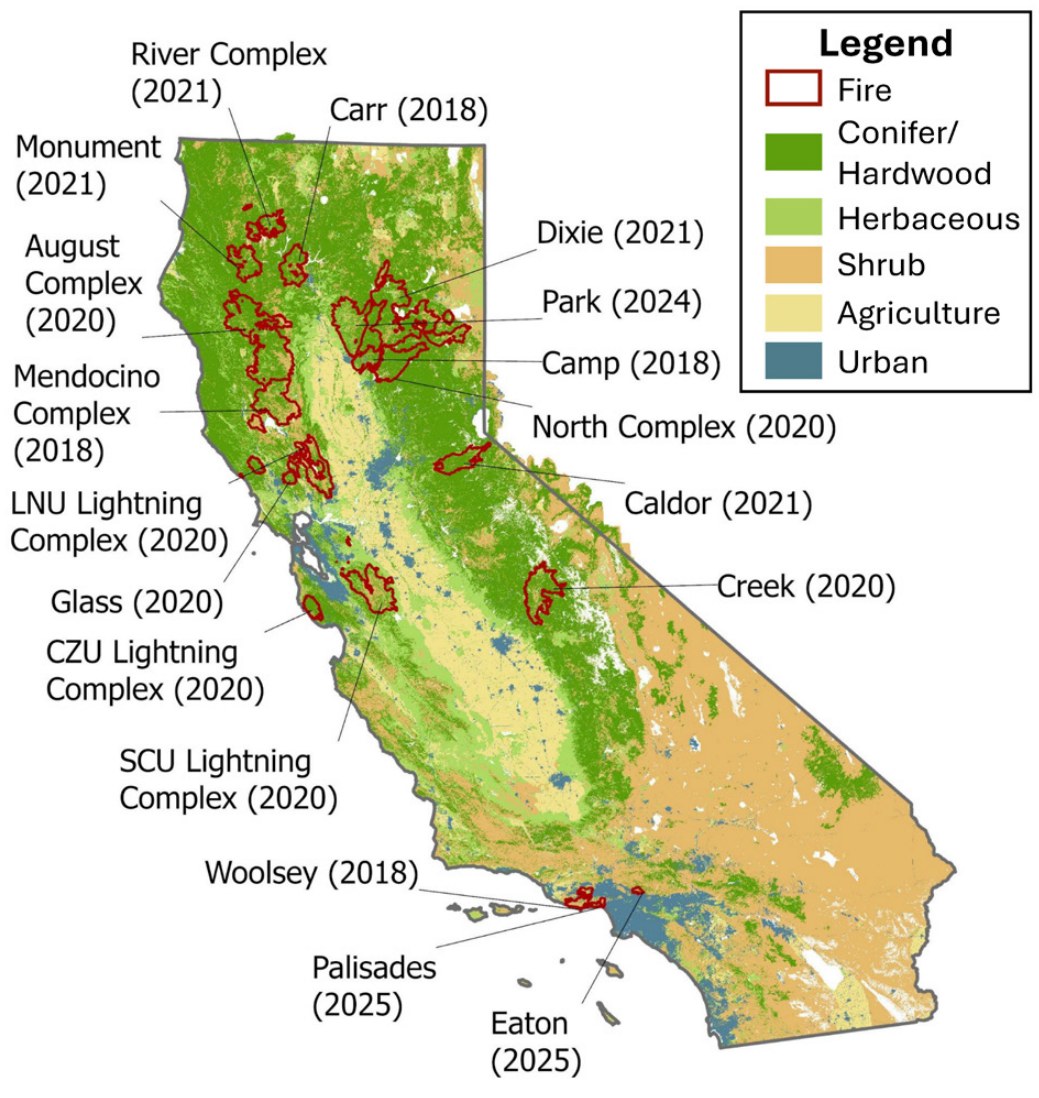
Figure 10 of the report: fires since 2018 among California's 20 largest, deadliest or most destructive, over CAL FIRE vegetation types. Figure by LCI Climate Services, State of California, 2026; cropped, caption removed.
California has published statewide climate change assessments since 2006, and the fifth responds to Senate Bill 1320 (Stern, 2020), which requires the State to report the projected impacts and risks of climate change at least every five years.1 The Governor's Office of Land Use and Climate Innovation (LCI) leads it, with the California Natural Resources Agency, the California Energy Commission and the Strategic Growth Council.1 The Fifth Assessment is a portfolio: new downscaled climate projections, original research on energy, climate hazards and tribal priorities, nine regional reports, topical and state agency reports, and this Statewide Summary, which draws their main findings together.1 The suggested citation names twelve authors, with Elea Becker Lowe and Abby Edwards of LCI as coordinating lead authors, and gives the year as 2026.1 The research was reviewed by expert reviewers and members of the Tribal Advisory Group and approved by an external editorial board.1 The disclaimer says "AI tools were used sparingly in the preparation of this report to refine language, generate preliminary code for data analysis, and summarize cited documents," all of it reviewed by the authors.1
The modelling chain. The projections begin with CMIP6, the coordinated set of global climate model runs.1 The Assessment mainly uses two emissions scenarios: SSP2-4.5, in which emissions hold near current levels and then fall after 2050, and SSP3-7.0, in which they double by 2100.1,4 A third, SSP5-8.5, with emissions tripling by 2075, is kept only as a worst-case reference; the report calls it very high and unlikely, not a plausible future.1,4 Global models are too coarse for local planning, so they are downscaled to finer grids for California by three methods: LOCA2, a statistical method; WRF, which runs a regional weather model; and LOCA2-Hybrid, a blend of the two.1,4 The projections themselves are in a California Energy Commission report by Kalansky and colleagues (2026).1 The Assessment's page for that work gives a 3 km grid and daily to hourly values.5 WRF supplies more than 30 variables from eight global models under one scenario, plus coarser runs over the western US for electricity planning.5 The hybrid method supplies daily values of key variables from many models under three scenarios.5 The same project produced hydrological projections and hourly sea level projections at coastal and Bay-Delta sites, and its data are on Cal-Adapt's Analytics Engine.5
Two ways of handling time run through the report. The Assessment introduces global warming levels, which ask "What happens to California once the world reaches a certain level of warming?" and put the size of the impact ahead of the calendar date, as a complement to the earlier date-based approach.1,4 Most analyses still compare three 30-year periods: a historical baseline of 1981 to 2010, mid-century 2041 to 2070 and late-century 2071 to 2100.1 Its chart of statewide temperature and precipitation shows the mean of a group of models with a band of one standard deviation.1 Other figures draw on observed records, among them the observations of Livneh and colleagues, NOAA's NClimGrid, ERA5-Land for snow and the US Drought Monitor.1
Nine regions. The Assessment divides the state into the North Coast, San Francisco Bay Area, Central Coast, Los Angeles, San Diego, Sacramento Valley, San Joaquin Valley, Sierra Nevada and Inland Deserts.1 The regions were drawn in the Fourth Assessment from climate, economic and environmental issues and, where practicable, county lines, and were revised for the Fifth after community feedback; each has its own regional report.3
What the projections show. Selected findings, with the scenario and period the report gives:
| Topic | Finding |
|---|---|
| Temperature | Up 3.5 to 4.3 °F (1.9 to 2.4 °C) by 2050 against 1981 to 2010; by 2100, 5.7 °F (3.2 °C) under SSP2-4.5 and 8.0 °F (4.4 °C) under SSP3-7.01 |
| Snow | Early April snowpack down about 40% by mid-century and 60% by late century; snow lines in the Sierra Nevada and southern Cascades up 450 to 500 m in 2051 to 2100 against 1951 to 20001 |
| Heat waves | Under high emissions the year's longest heat wave grows from about three days to 6 in the Bay Area, 12 on the North Coast, 14 in the Sacramento Valley, 17 in the Inland Deserts and 19 in the Sierra Nevada by late century1 |
| Wildfire smoke | More than 5,000 excess deaths a year from smoke by 2050 against 2011 to 2020, the largest rise of any US state1 |
| Drought | Joint heat wave and drought events two to eight times as frequent as in 1995 to 2014; irrigated land in the San Joaquin Valley down by up to about 40%1 |
| Sea level | 0.8 ft by 2050 against 2000 under the Intermediate scenario; 3.1 to 6.6 ft by 2100 and 6.1 to 11.9 ft by 2150 across the Intermediate and High scenarios1 |
| Coastal exposure | With 3.3 ft, 201,000 people and $78 billion of property exposed to coastal flooding; 310,000 people and $122 billion with a 100-year storm1 |
The report also sets out what has already happened. Since 2010 all but two years have been warmer than the 1981 to 2010 average of 58.2 °F (14.6 °C).1 Twelve of the 20 largest, 11 of the 20 most destructive and six of the 20 deadliest wildfires on record in California have burned since 2018.1 The picture above is the report's map of these fires.1 Over the last 30 years, 67% of the state's wildfires were started by people or infrastructure.1 From 2019 to 2024 electricity rose about 6.2 cents per kilowatt-hour, about 5 cents of it from wildfire-related costs, and home insurance premiums for single-family homes rose 85% on average between 2020 and 2026.1 Higher temperatures have made drought 42% more severe, by a study the report cites.1 In the San Joaquin Valley the 2012 to 2016 drought was the driest period in more than 1,200 years, and in the 2020 to 2022 drought more than 2,000 domestic wells went dry statewide.1 About 7 million Californians, one in five, live in areas at risk of flooding; atmospheric rivers bring half the state's precipitation in about 120 hours a year and are projected to become more intense and clustered.1 On the coast, rising groundwater pushed up by the sea would expose 1.9 million residents and $480 billion of property with 1 m of rise, eight times the exposure from tidal flooding over land.1 Acidification along the coast is proceeding at twice the global rate because upwelling brings naturally acidic water to the surface.1 Places this site covers that the report discusses include the Sacramento-San Joaquin Delta, San Joaquin Valley groundwater and the Colorado River, from which California's share could fall by about 0.5 to 0.8 million acre-feet a year in coming decades.1
Tools for modelling and forecasting. The report names several models and methods in use.1
- The US Geological Survey's Coastal Storm Modeling System (CoSMoS) projects flooding for daily conditions and annual, 20-year and 100-year storms, under sea level rise from 0 to 3.0 m and an extreme 5.0 m.
- CoSMoS Adapts, led by UC Santa Cruz with the USGS and supported by the Assessment, compared the costs and benefits of dunes, artificial reefs, seawalls and other measures in seven pilot places. Nature-based measures such as dune restoration were generally the most cost-effective, with high variation between places.
- Hourly sea level projections for tide stations, made for the Assessment, help find the hourly extremes that cause flooding over the next 30 years.
- The Department of Water Resources' Tuolumne River study turns projected changes in precipitation and runoff into new estimates of flood extent and exposure, for future updates of the Central Valley Flood Protection Plan.
- Forecast-informed reservoir operations use atmospheric river and runoff forecasts in place of rule curves set from historical hydrology.
- Flood-managed aquifer recharge spreads floodwater on fields to refill groundwater; 3.6 million acres of agricultural land have good or excellent potential, and aerial electromagnetic surveys can target where to recharge.
- A model of 25,000 miles of PG&E power lines in high fire-risk areas, built on weather and vegetation data, estimates ignitions avoided by each kind of grid hardening; fast-trip settings cut vegetation-caused ignitions by about 80% in PG&E's area.
- Satellite imagery is improving statewide projections of beach loss, which put the share of beaches that could disappear, seasonally or permanently, by 2100 without intervention at 24 to 75%.
Limits the report states. The Fifth Assessment is not a strategic plan, guidance document or regulation, does not pick one adaptation pathway for every community, and does not remove the uncertainty in projecting future climate; in its words, the Assessments "do not predict the future."1 Its disclaimer says the report does not necessarily represent the views of the coordinating agencies.1 Specific gaps and disagreements:1
- Drought is hard to project because it builds slowly and depends on interacting climate and water management, and future precipitation stays highly variable.
- Snowpack projections vary with the method of analysis; a review it cites found Sierra Nevada losses of about 50% by 2050 to 2074 and 65% by 2075 to 2099.
- Sea level projections widen sharply toward 2100 because of uncertain processes such as early ice sheet loss; the H++ scenario of the 2018 State guidance is no longer considered plausible.
- Two studies disagree on heat and health: one projects that fewer cold deaths will outweigh more heat deaths statewide, the other that mortality rises across most of the state. Estimates of deaths in the September 2022 heat wave range from 200 to 395 depending on method.
- FEMA's flood maps are often said to underestimate risk because they leave out future sea level rise and heavier rain; about 180,000 Californians hold federal flood insurance while an independent estimate puts 1.1 million properties at risk.
- Northern California's main reservoirs coped with the atmospheric river floods tested, but those events do not represent every possible future flood.
- The effects of wildfire on livestock need further quantifying, and information on how the court-adjudicated groundwater basins, home to nearly 11 million people, are managed is fragmented.
For someone modelling a place. The Assessment fixes a common frame for California: the same CMIP6 models, two main scenarios, three 30-year windows or a chosen warming level, a 3 km grid, and nine regions.1,5 A local model built on that frame can be compared directly with the State's figures and its regional report, and the projections can be cut to a study area from Cal-Adapt.5 The report warns that adaptation planning for one risk at a time may miss compound and cascading hazards, such as drought drying vegetation into fuel, or rain on burned slopes setting off debris flows.1 Several findings depend on layers a surface model can leave out. In the Bay Area more than 1,500 active contaminated sites could be inundated from below by groundwater with 3.3 ft of sea level rise.1 Parts of the Delta are already about 20 feet below sea level behind aging levees.1 Related everyday questions on this site are whether a home can be insured against fire and whether a property will flood.
The figure is the State's own work, and the conditions of use on its websites treat their content as public domain unless otherwise indicated.6
- url
- https://www.climateassessment.ca.gov/research/statewide-summary/
- published
- 2026-10
- publisher
- California Governor's Office of Land Use and Climate Innovation
- authors
- E. Becker Lowe, A. Edwards, N. Malakooti, B. McMahan, C. Ballek, J. Jamison, B. Lewis-Smith, H. Bliska, C. Bennett, J. Phillips, G. Franco, D. Stoms
refers to this entry as a source
-
The world's climate models run through common experiments of past and future climate, with the output shared under CC BY 4.0 through the Earth System Grid Federation.
open dataAPI
-
ECMWF's hourly reconstruction of the world's weather from 1940 to a few days ago, under CC BY from the Copernicus Climate Data Store; ERA5-Land is a finer land version from 1950.
open dataAPI
requires this data or input
-
California's public climate data platform, funded by the California Energy Commission, serving the 3 km projections behind the State's Fifth Climate Change Assessment.
open sourceopen dataAPIpartly open participation
helps answer this question
-
What weather is coming this week, and how will the climate of this place change over the coming decades?
-
Where might a fire spread from here, what is exposed, and where would clearing, burning or hardening give the most protection?
-
Which areas will flood, how often, and what would changing a river, drain or pump do to the flooding?
Tags: California, climate projections, downscaling, LOCA2, global warming levels, wildfire, drought, sea level rise, extreme heat, report