data source · draft
Hansen Global Forest Change
The University of Maryland's global 30 m maps of tree cover in 2000 and of the year forest was lost since, from Landsat imagery; updated yearly, free under CC BY 4.0.
Living systemsWeather & climate
What is reusable: unknown sourceopen dataAPIunknown participation CC BY 4.0
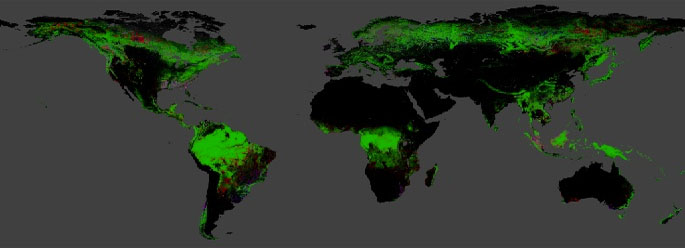
World map of tree cover, loss and gain, from the data download page. Source: Hansen/UMD/Google/USGS/NASA, CC BY 4.0.
Global Forest Change is a set of world maps of forest extent and loss, made from time series of Landsat satellite images.1 Its makers are the Global Land Analysis and Discovery (GLAD) laboratory at the University of Maryland, working with Global Forest Watch, now Global Nature Watch.1 The method is described in "High-Resolution Global Maps of 21st-Century Forest Cover Change" by Matthew Hansen and colleagues, in Science, November 2013.1,3 Version 1.13, the current one, covers 2000 to 2025.1,2
The maps come in 10-by-10-degree tiles at 1 arc-second, about 30 m at the equator.1 The layers are:1,2
- tree canopy cover in 2000, the share of each cell covered by vegetation taller than 5 m1
- forest gain from 2000 to 2012, not updated since2
- the year of forest loss, where loss means a change from forest to non-forest1
- a mask of land and water1
- cloud-free Landsat composites from around 2000 and from the last year1
Only the loss year and the last composite are updated each year.1
The makers describe the limits. Changes in the Landsat sensors, in the number of images each year and in the algorithm mean that years are not strictly comparable.1 Loss from 2011 onward has been reprocessed with newer methods, while earlier years have not.1 A full validation with Landsat 8 data has not been done.1 They call the maps a relative indicator of trends, suggest smoothing them over time, for example with a three-year moving average, and say forest area should not be estimated by counting pixels; instead the maps can guide a statistical sample.1 A version 2.0 reprocessing of the whole record is planned with no date set.1
The data are licensed CC BY 4.0, free for any use including commercial, with the display credit "Source: Hansen/UMD/Google/USGS/NASA".1 Tiles can be downloaded as GeoTIFFs, and the whole set is also an asset in the Google Earth Engine catalogue, where it can be analysed in place; the makers provide an introductory tutorial.1,2 They ask users to register so they can keep them informed of updates.1
For someone modelling a place, the maps give a year-by-year record since 2001 of where tree cover was lost, at about 30 m, starting from the tree cover of 2000.1 The updated method detects some kinds of loss better: fire in boreal forests, smallholder rotation clearing in the tropics, selective logging and the clearing of short-cycle plantations.1 Comparing one year with another needs their warnings in mind.1
- coverage
- global land, 80°N to 60°S
- resolution
- 1 arc-second (about 30 m at the equator)
- cadence
- annual; version 1.13 covers 2000 to 2025
- access
- free tile downloads (10° by 10° GeoTIFFs) from Google Cloud Storage; Earth Engine asset UMD/hansen/global_forest_change_2025_v1_13; web map
- format
- GeoTIFF, unsigned 8-bit
- homepage
- https://glad.earthengine.app/view/global-forest-change
is a part of this larger thing
-
Google's cloud platform for analysing satellite imagery and map data from its own catalogue, through a browser code editor or Python; free for noncommercial use within quotas, paid otherwise.
partly open sourcepartly open dataAPIclosed participation
contributes to this work
Website from the World Resources Institute, called Global Forest Watch until 2026, that publishes free global data, maps and alerts on forests and is widening to grasslands and farmland.
open data
helps answer this question
-
If land changes use, farm to housing, forest to pasture, floodplain to park, what happens to water, habitat, carbon and food?
needed by
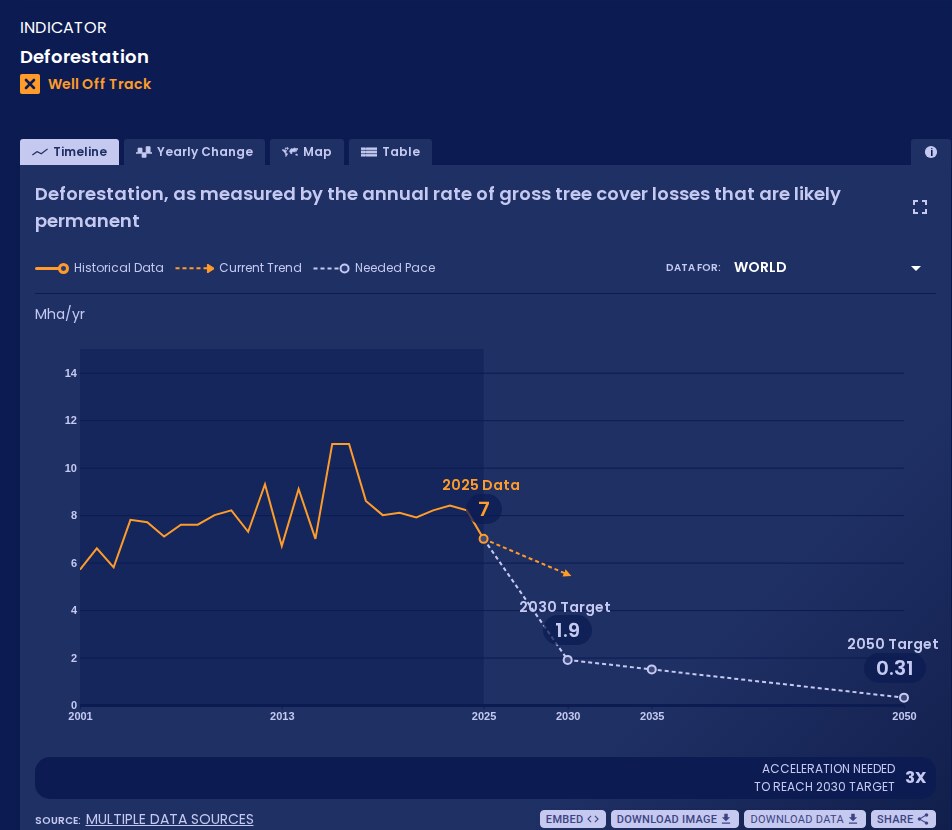
WRI and Bezos Earth Fund platform that measures global progress on more than 70 shifts, from power to forests, against targets for 2030 and 2050; data free under CC BY 4.0.
open data
Tags: forests, deforestation, tree cover loss, Landsat, land cover, raster